General Motors Company's management explains the business in its own materials. The slides below do the most of that work, pulled from the documents preserved in Sources. Each source link opens the complete presentation at that slide in a new tab.
A standalone deck on OnStar and Super Cruise: what the subscription business is, how prepaid plans convert, and what it earns. · Open the full document →
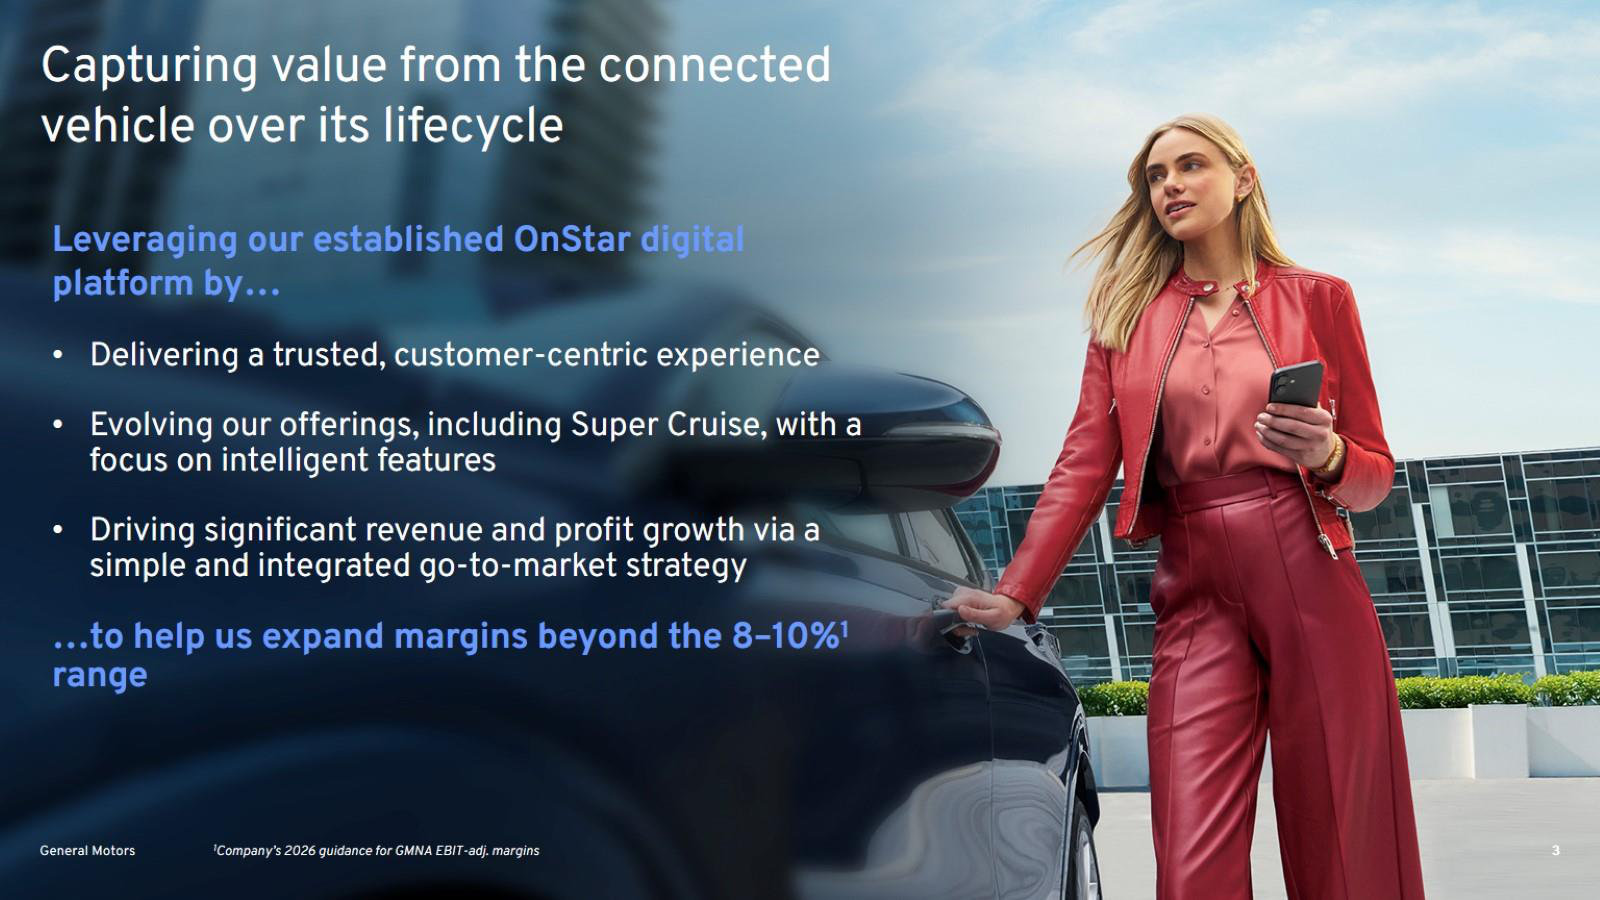
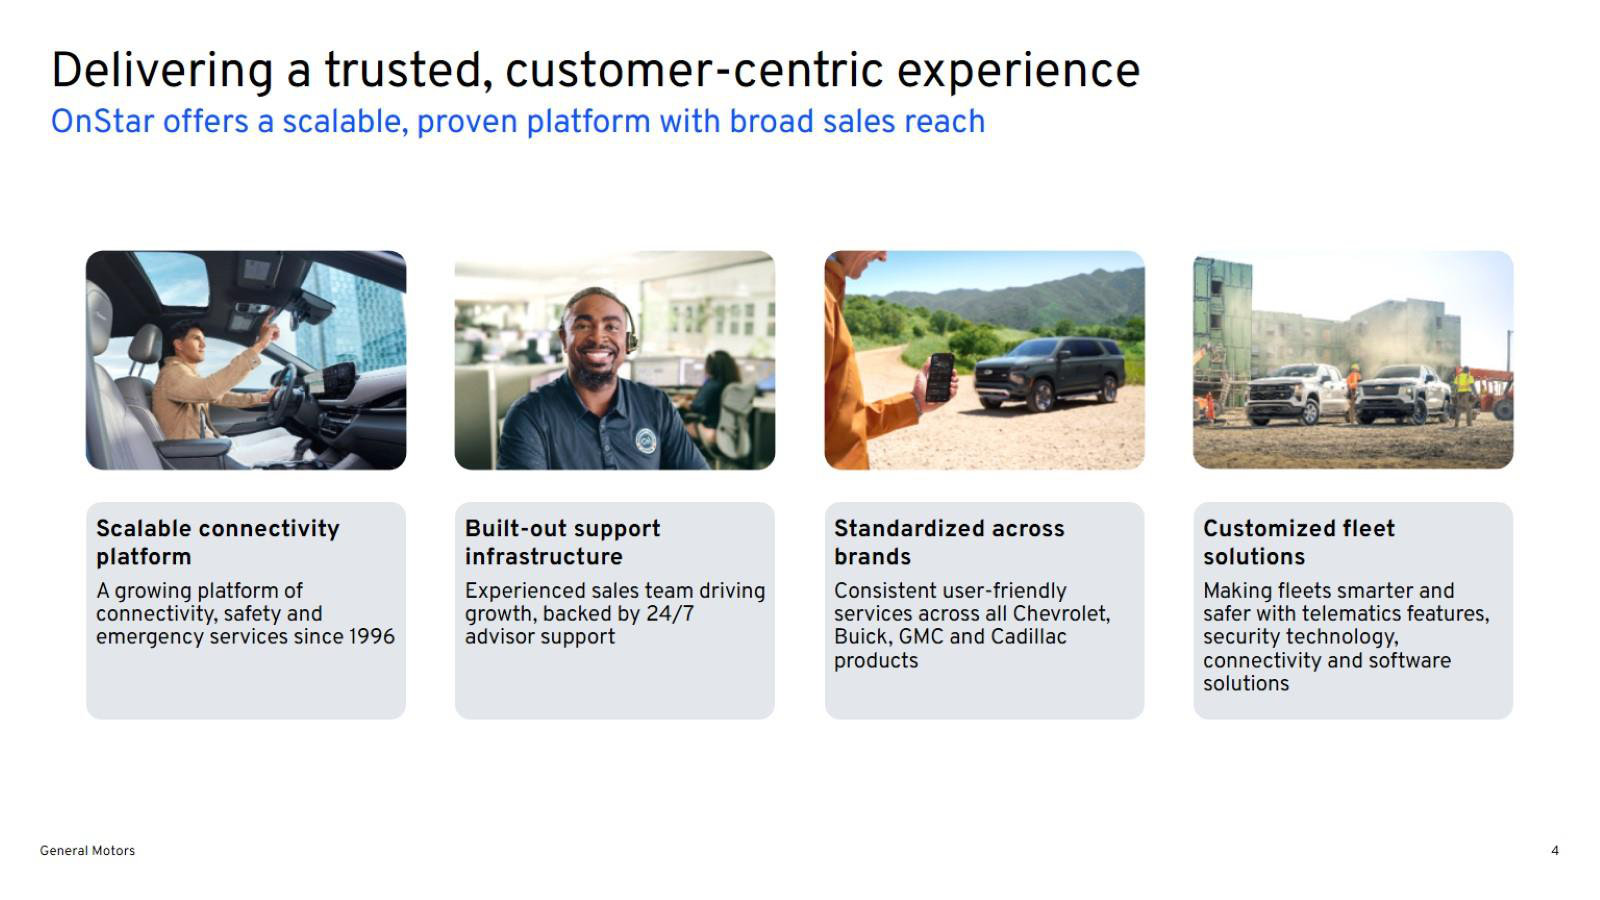
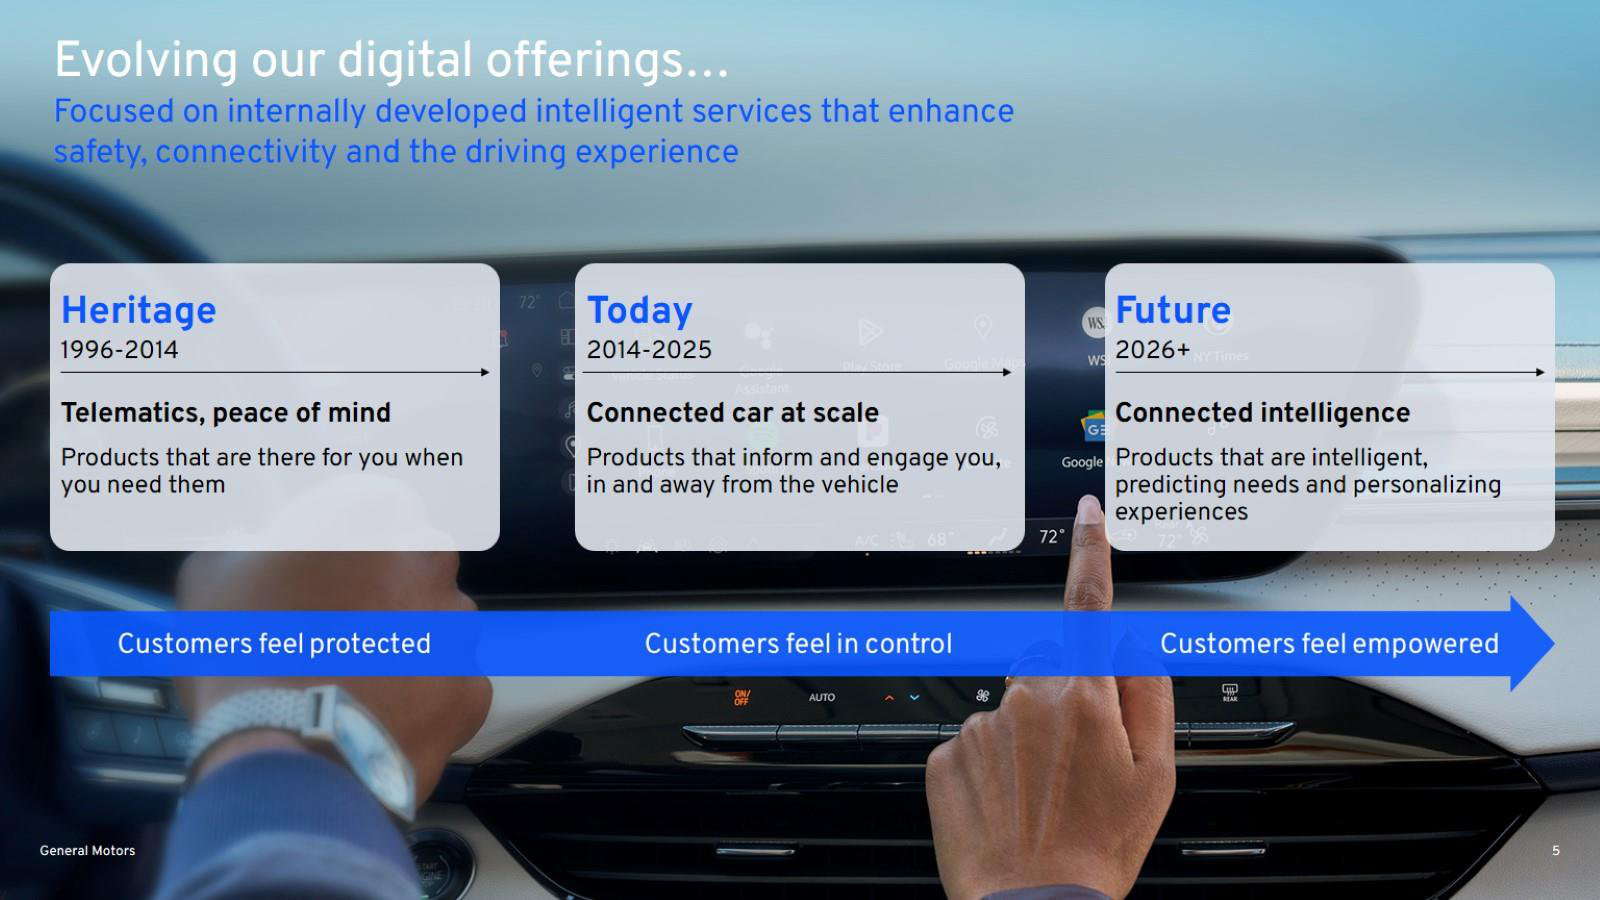
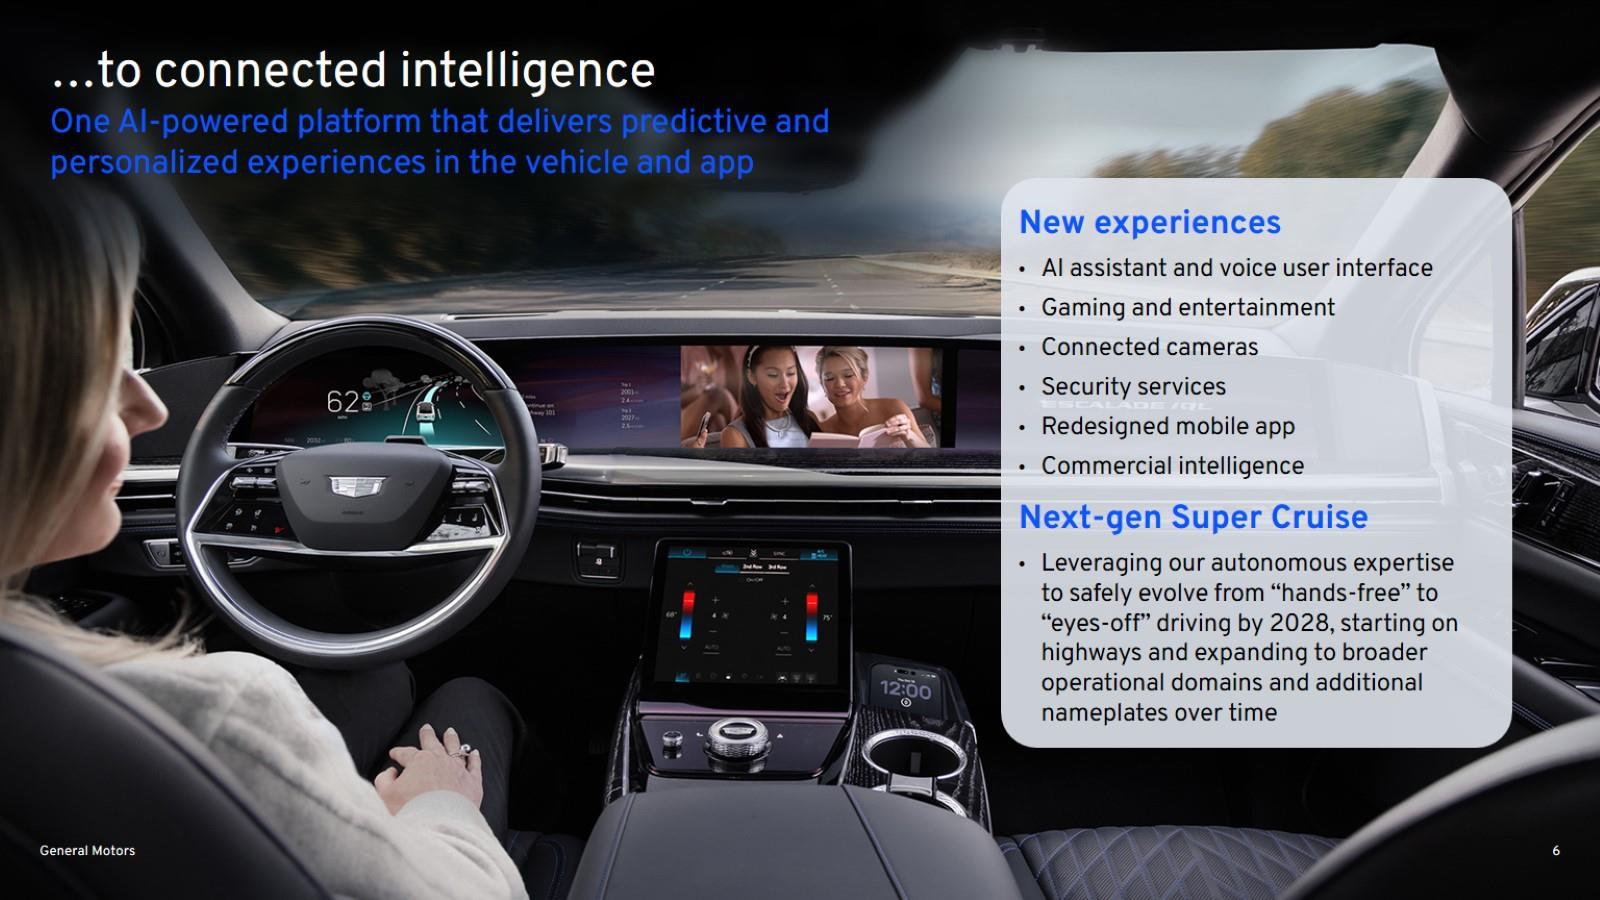
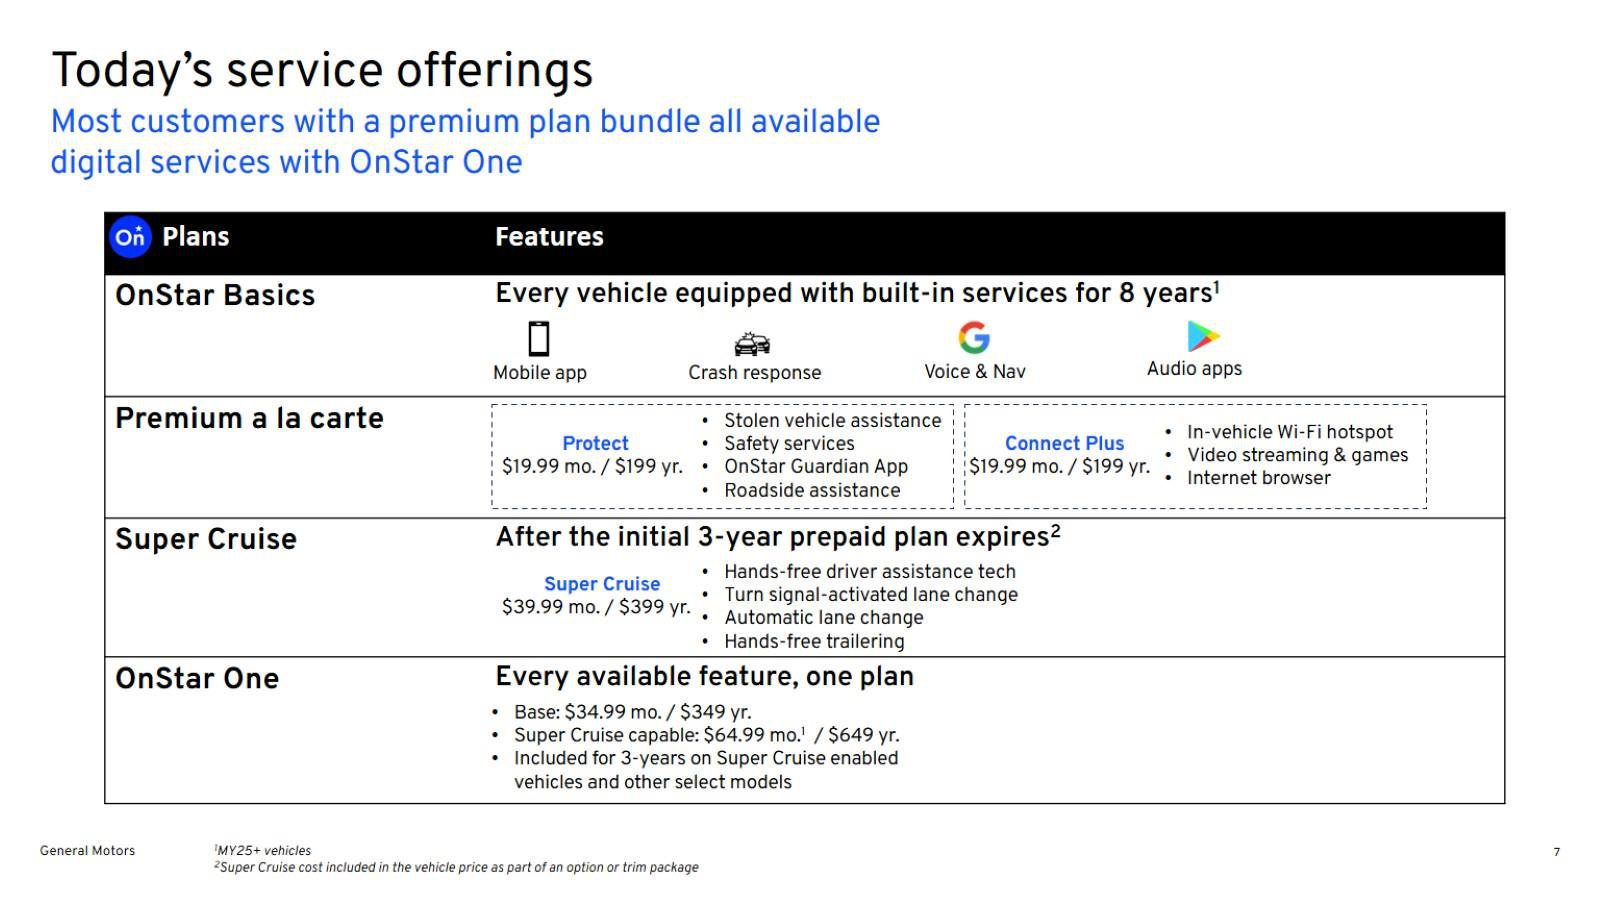
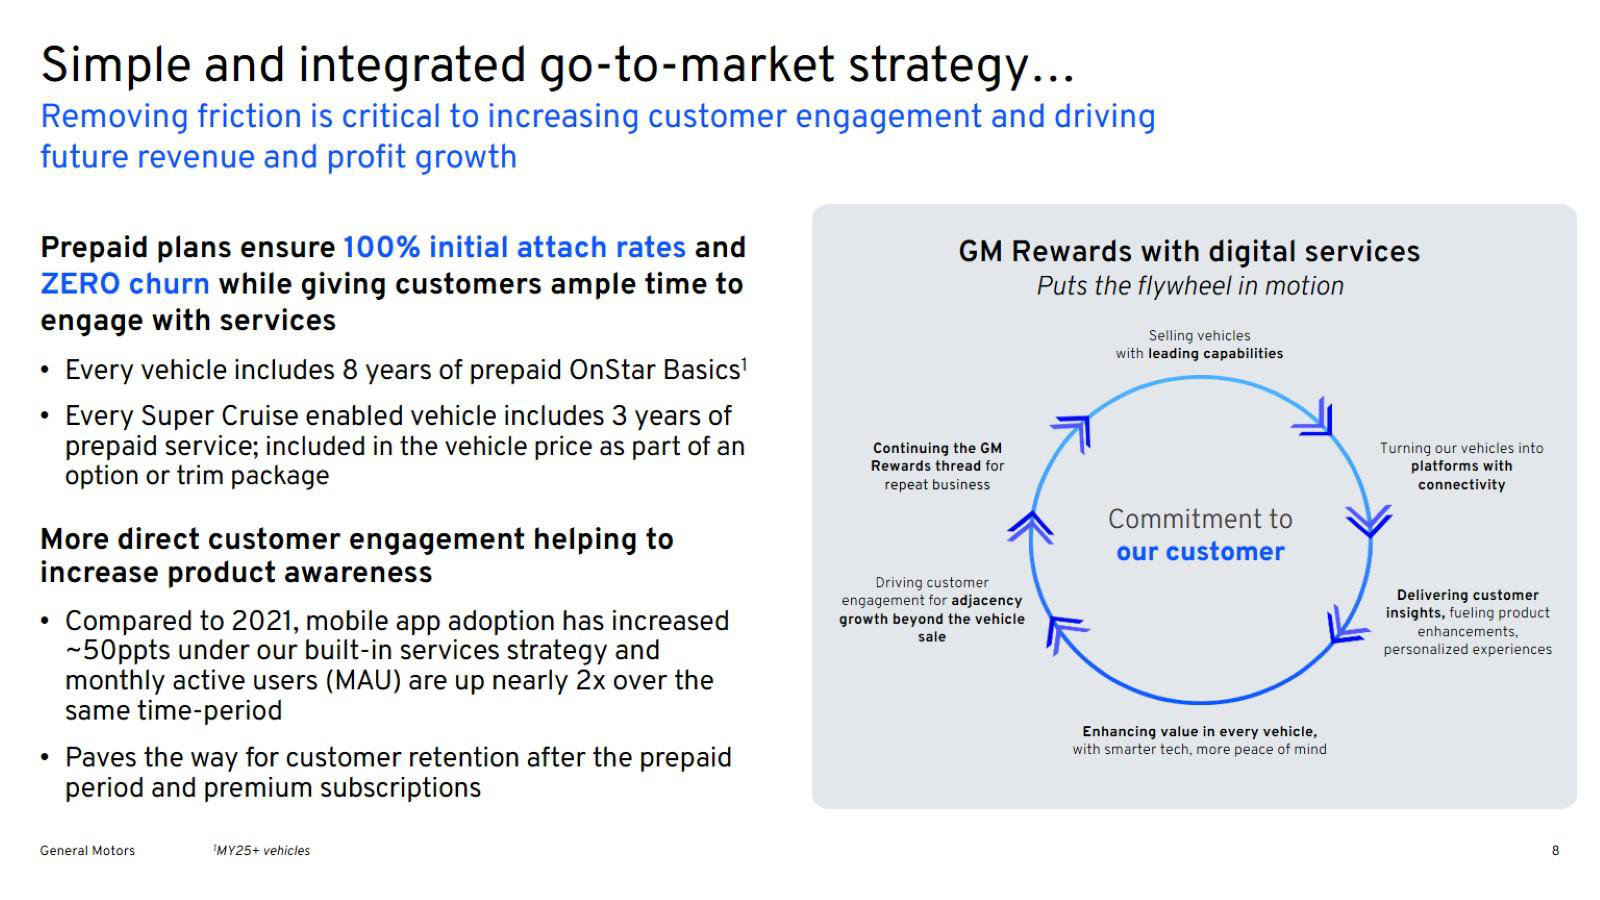
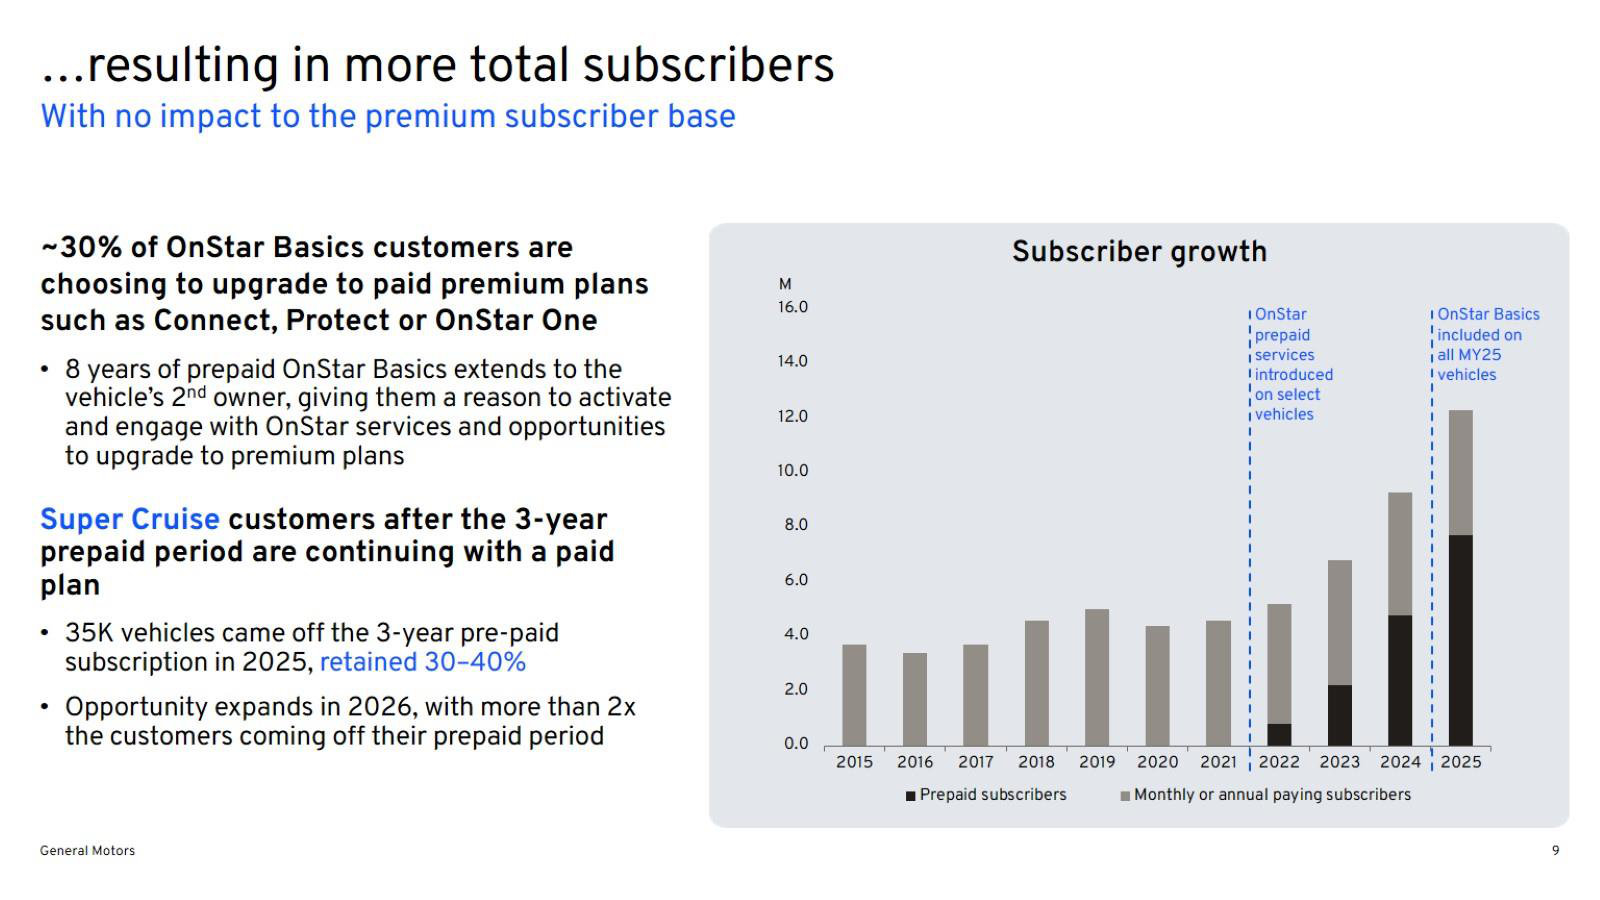
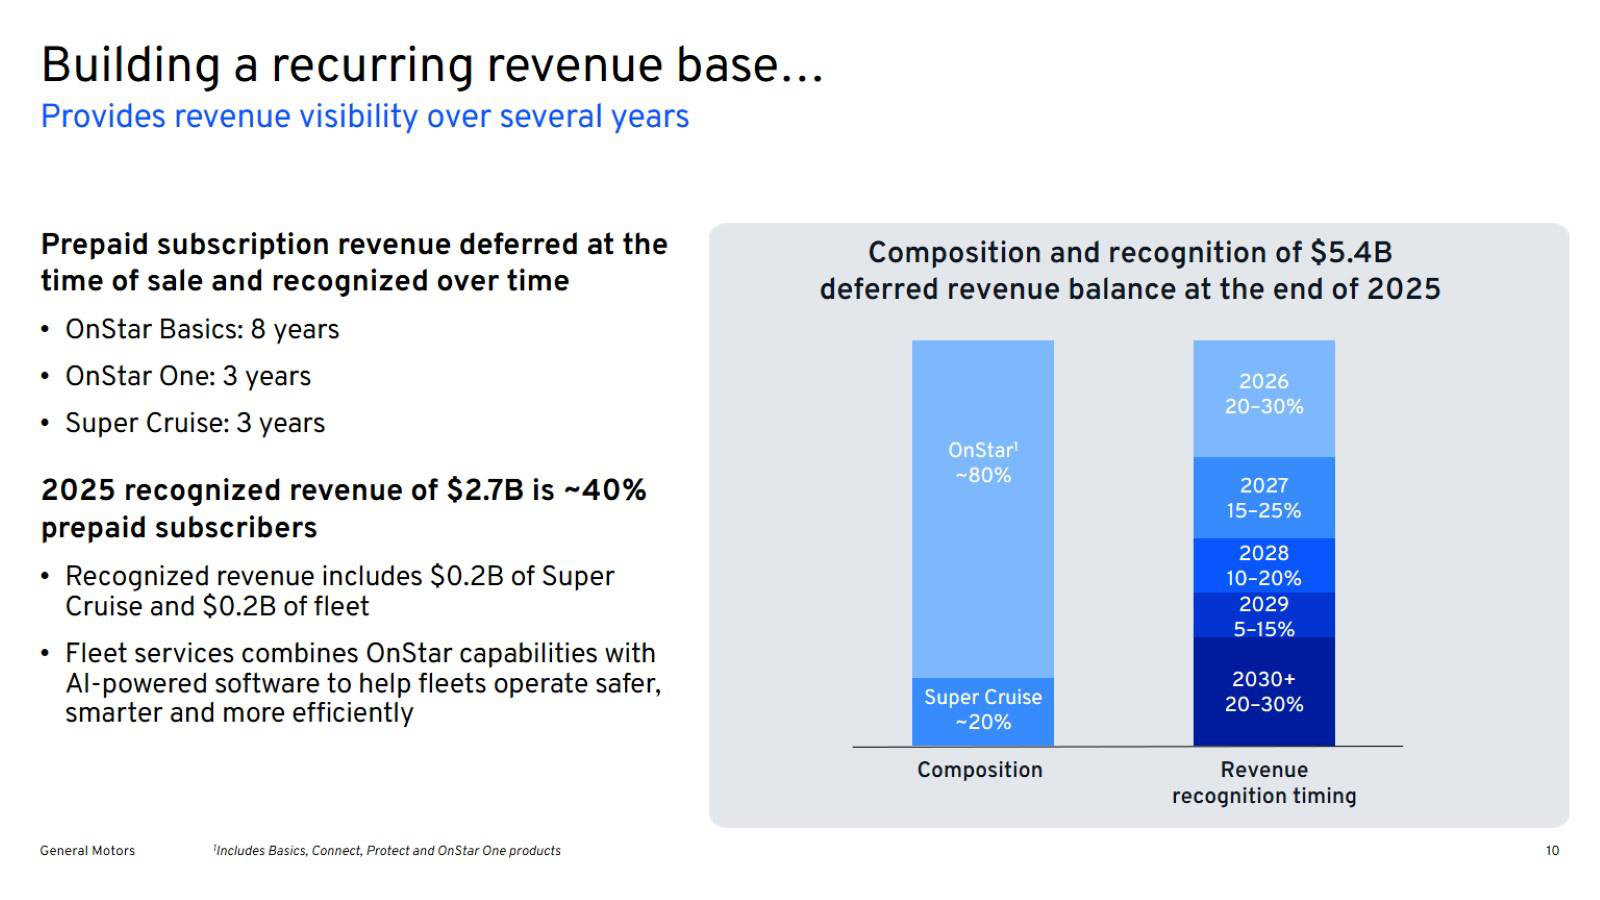
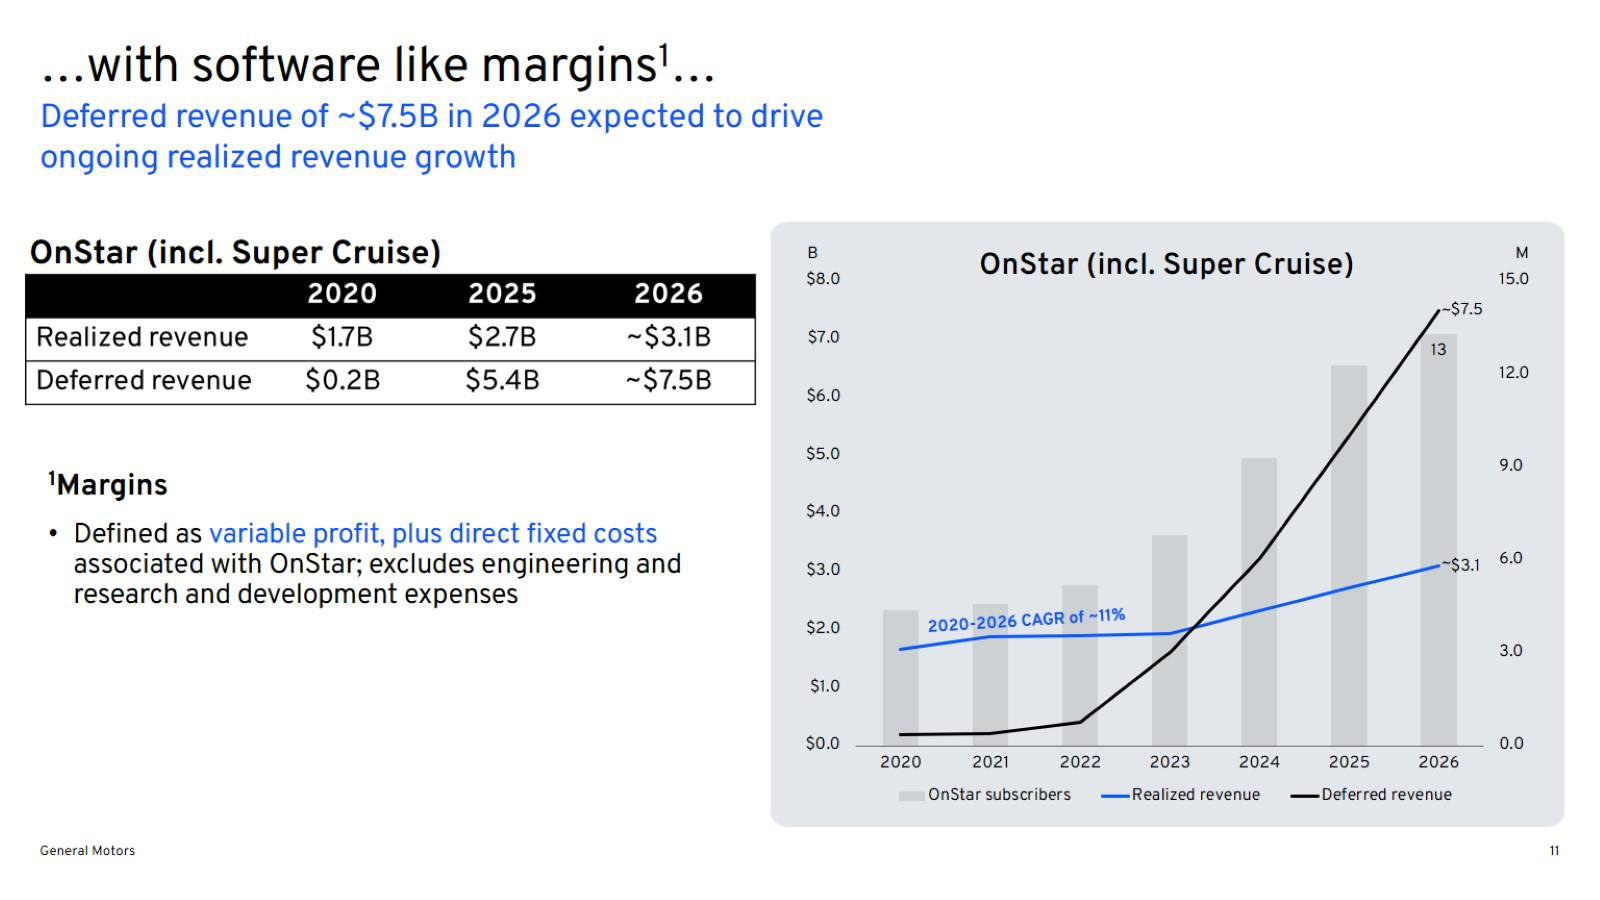
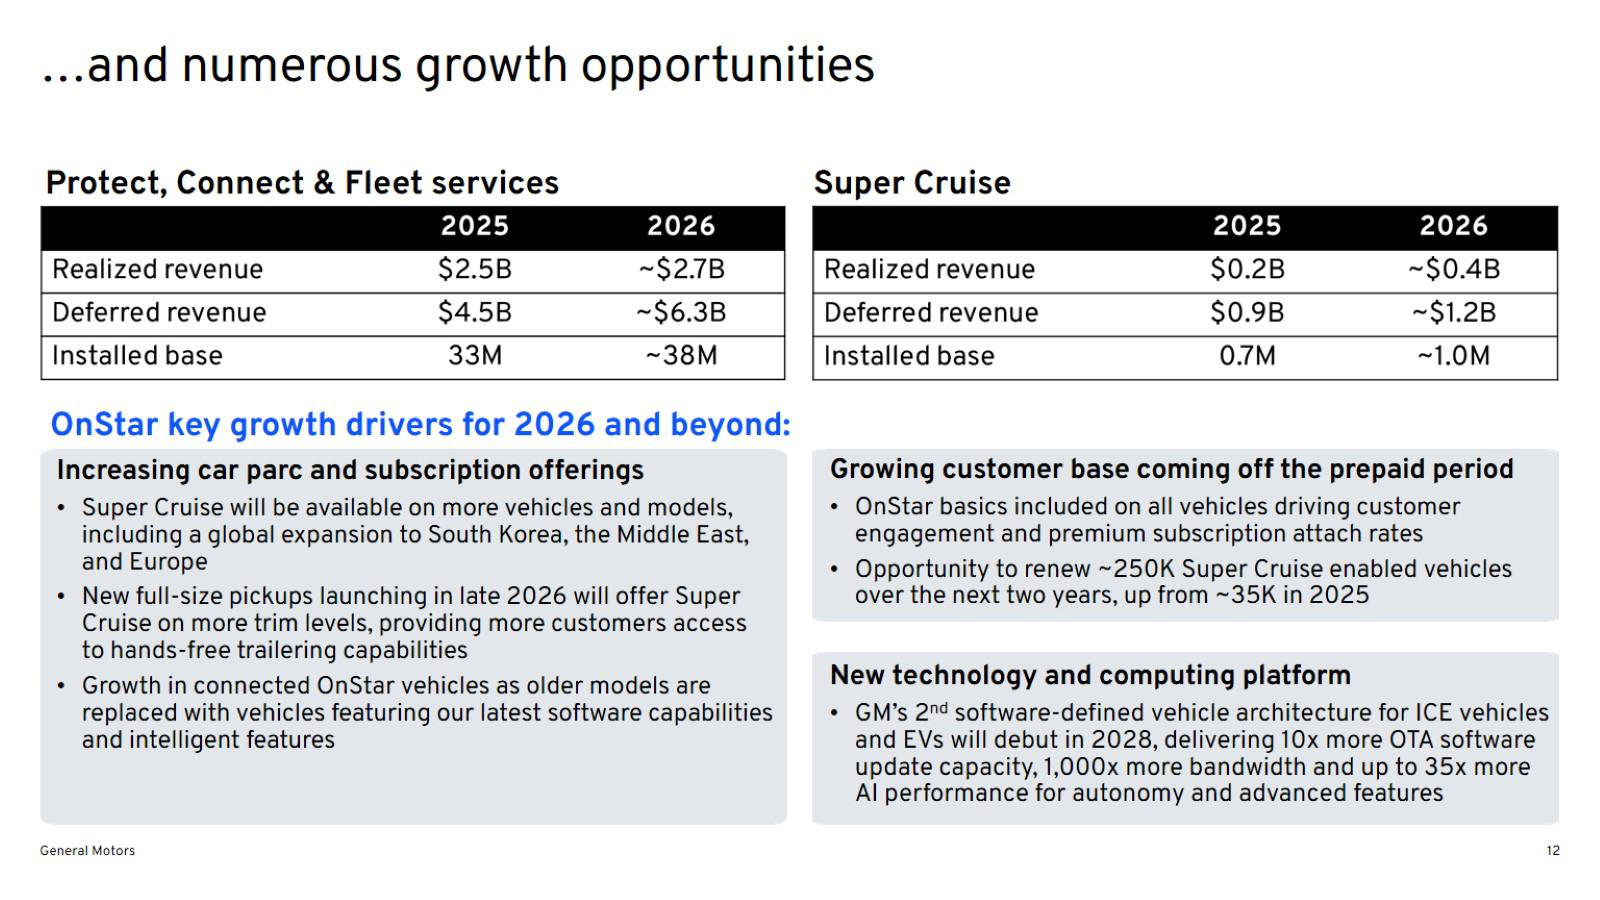
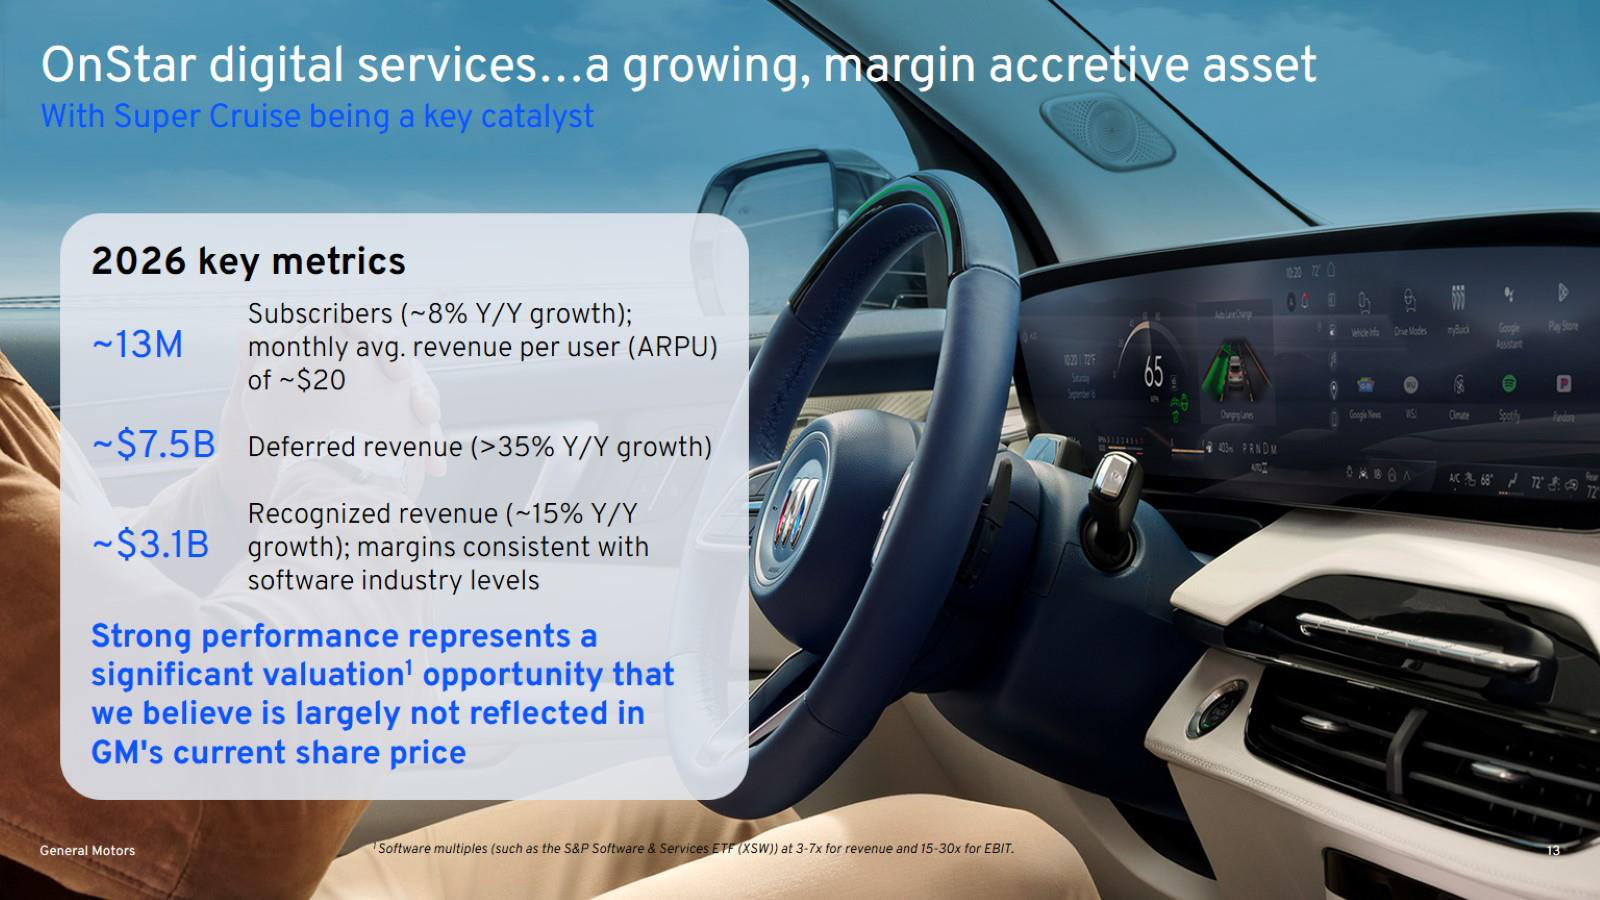
p. 3 — The thesis in one slide: use the existing OnStar platform to push margins past the 8-10% North America range. · Open the full presentation →p. 4 — What the platform actually is - connectivity, 24/7 advisors, one stack across four brands, plus fleet telematics. · Open the full presentation →p. 5 — Three eras of the product, 1996 to 2026+, and what management thinks it is selling at each stage. · Open the full presentation →p. 6 — The next product step: an AI platform in car and app, with Super Cruise moving from hands-free to eyes-off by 2028. · Open the full presentation →p. 7 — The price list - plan tiers, features and monthly rates, including the $64.99 Super Cruise-capable bundle. · Open the full presentation →p. 8 — How the subscription reaches the customer: 8 years prepaid at 100% attach and zero churn, feeding the rewards flywheel. · Open the full presentation →p. 9 — Subscriber growth split between prepaid and paying, with ~30% of Basics users upgrading to a premium plan. · Open the full presentation →p. 10 — The accounting that matters here - $5.4B of deferred revenue at end-2025 and the years it gets recognized in. · Open the full presentation →p. 11 — Realized versus deferred revenue, 2020-2026, and GM's own definition of the 'software-like' margin. · Open the full presentation →p. 12 — The two revenue lines broken out - Protect/Connect/Fleet against Super Cruise - with installed base and 2026 drivers. · Open the full presentation →p. 13 — Summary economics: ~13M subscribers, ~$20 monthly ARPU, ~$3.1B recognized revenue, and the valuation claim attached. · Open the full presentation →
The clearest overview of how GM makes money: a decade of restructuring, pricing, the captive finance arm and capital returns. · Open the full document →
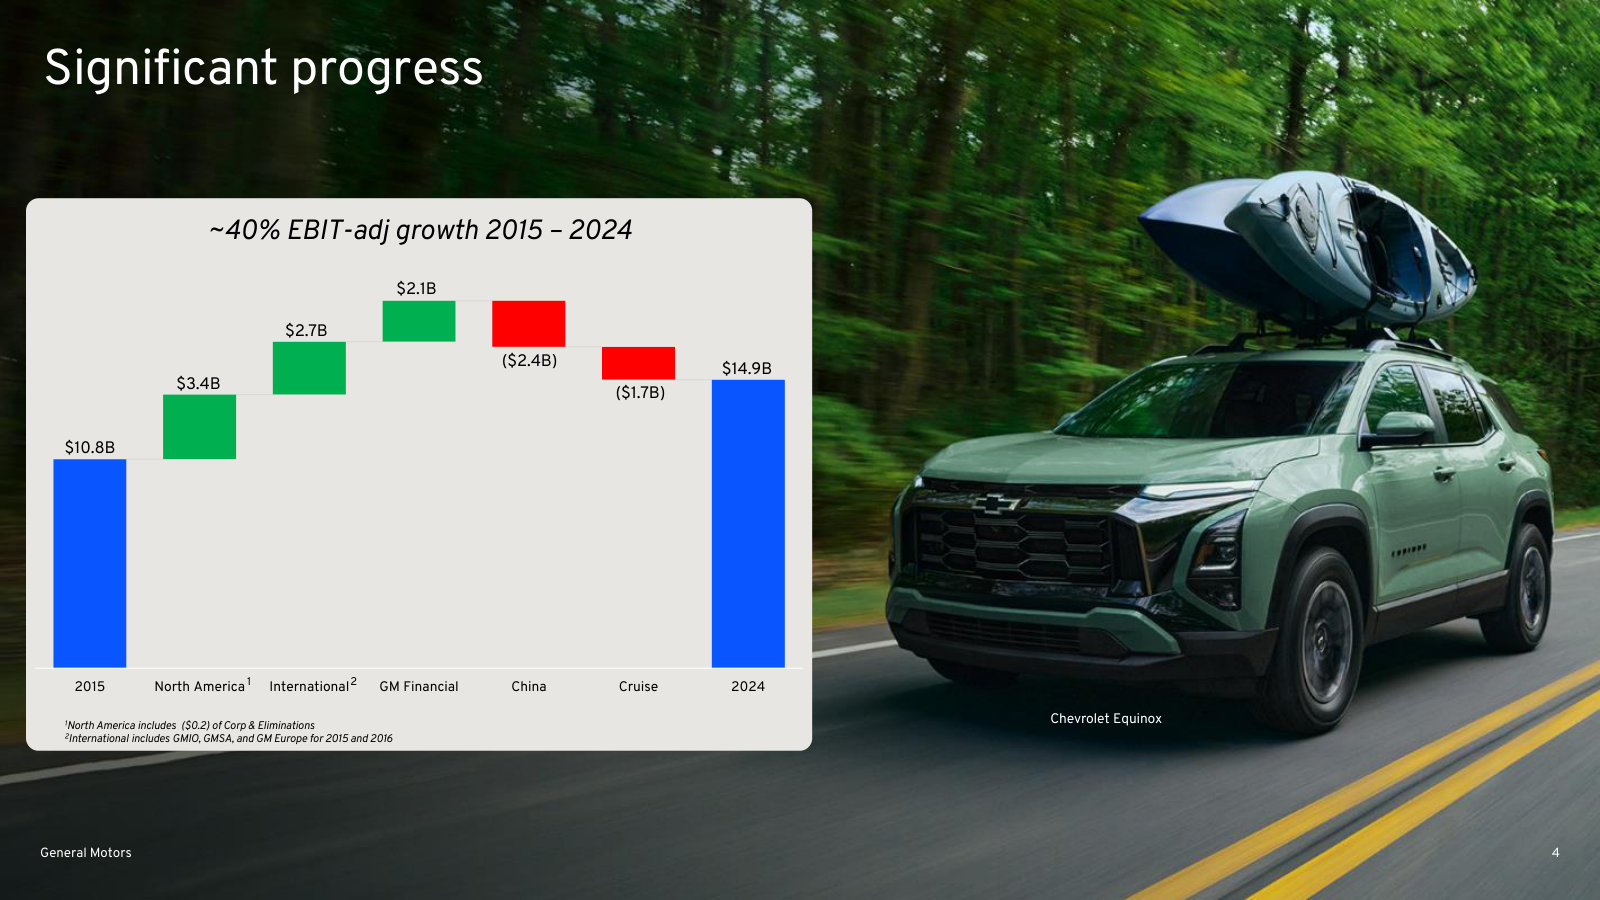
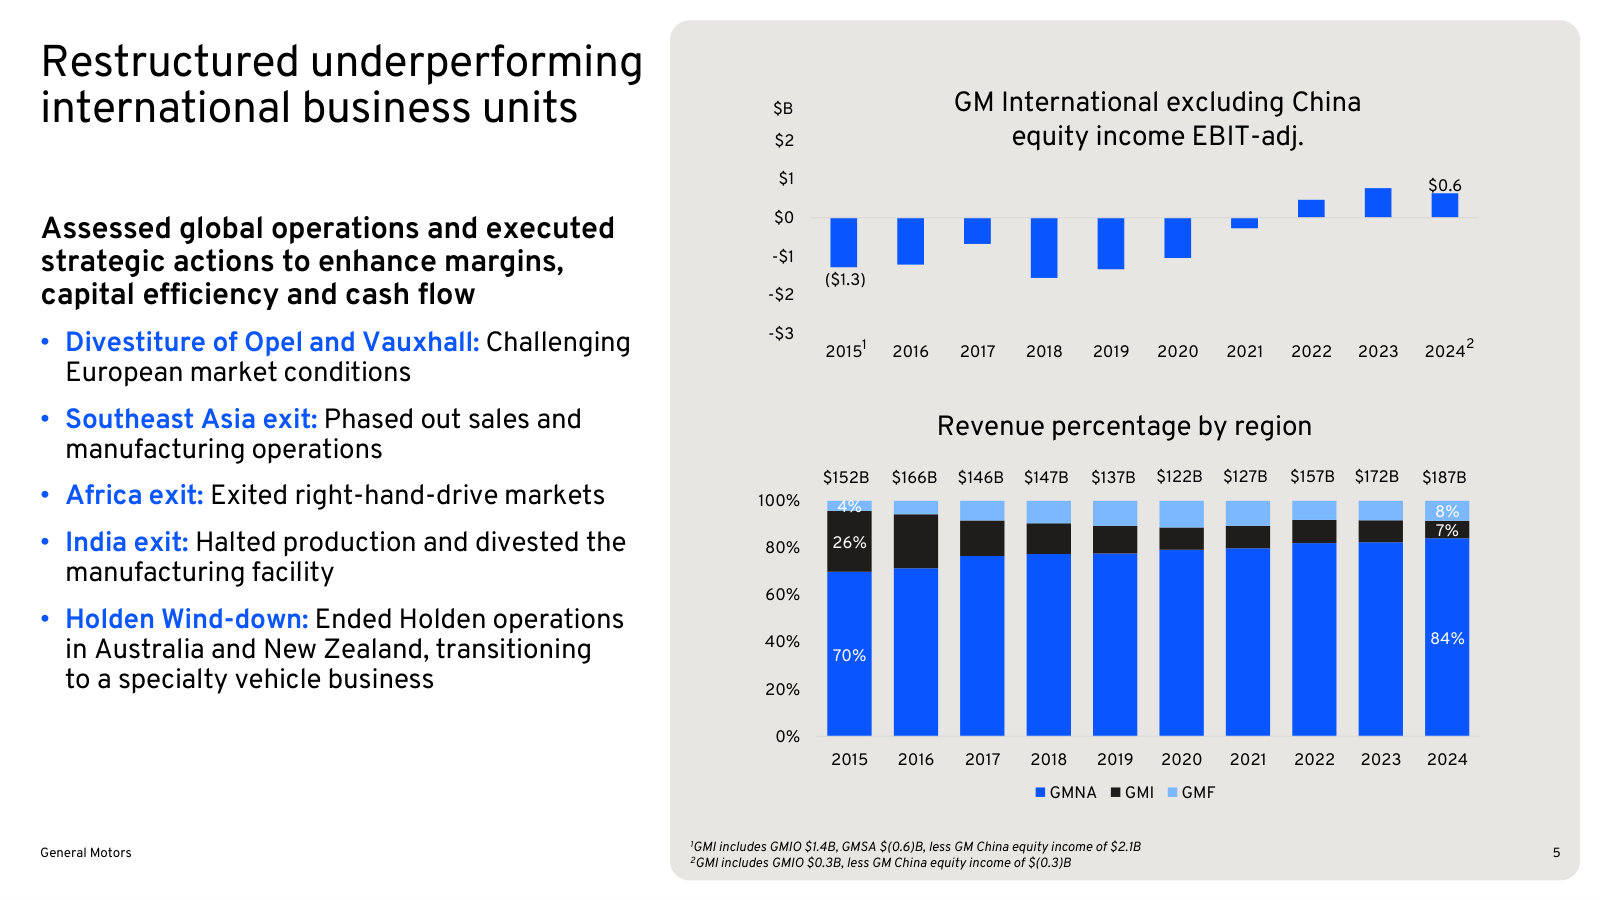
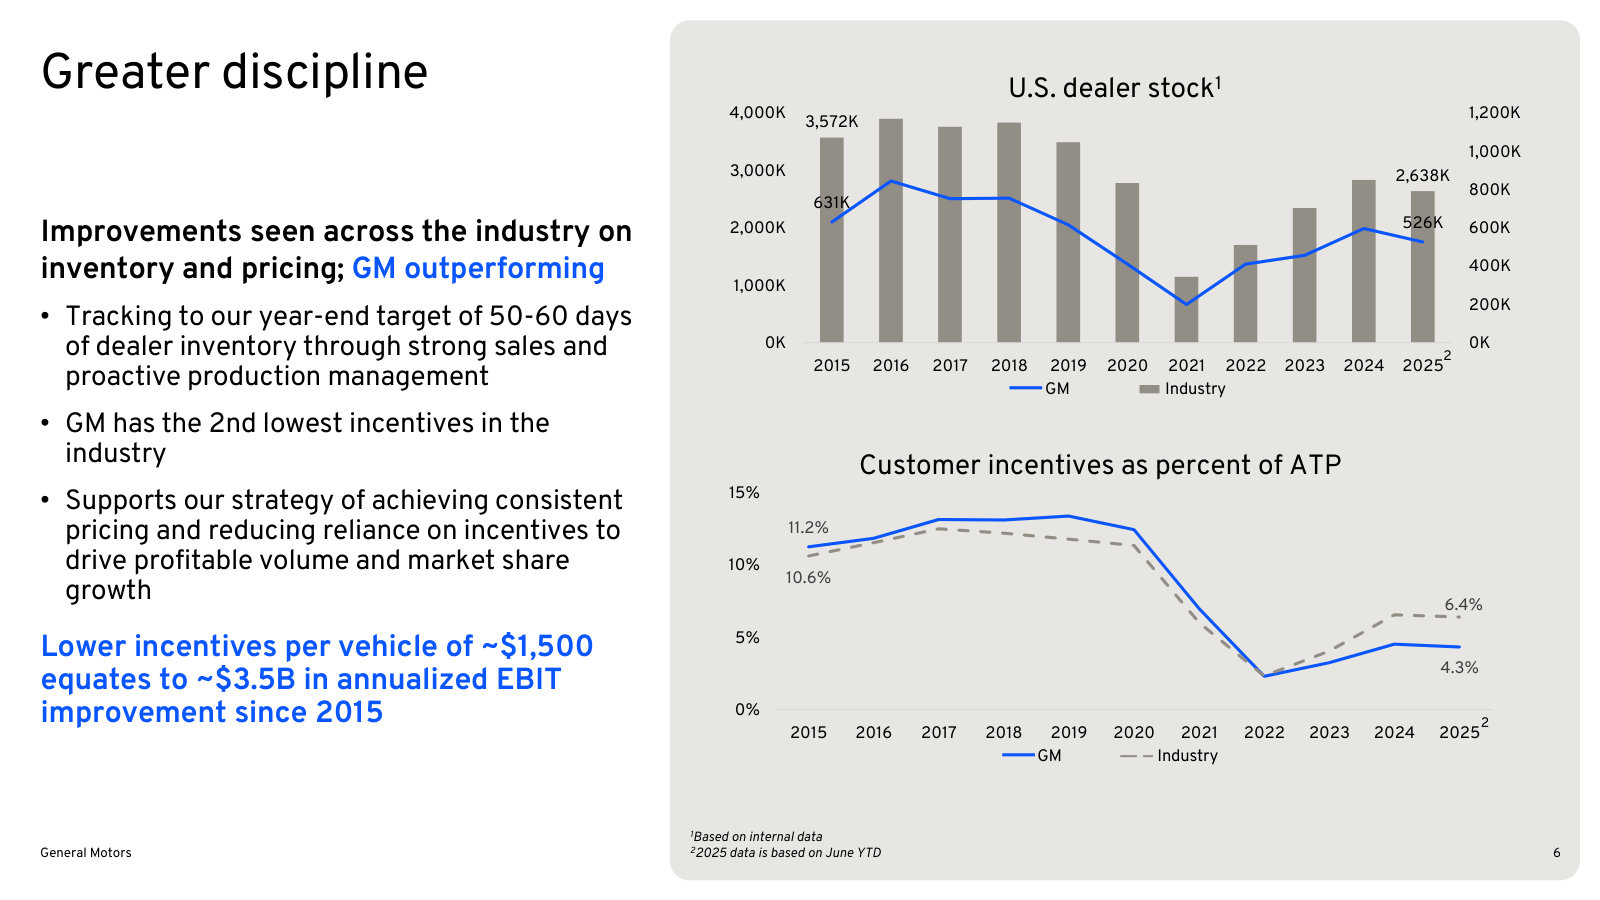
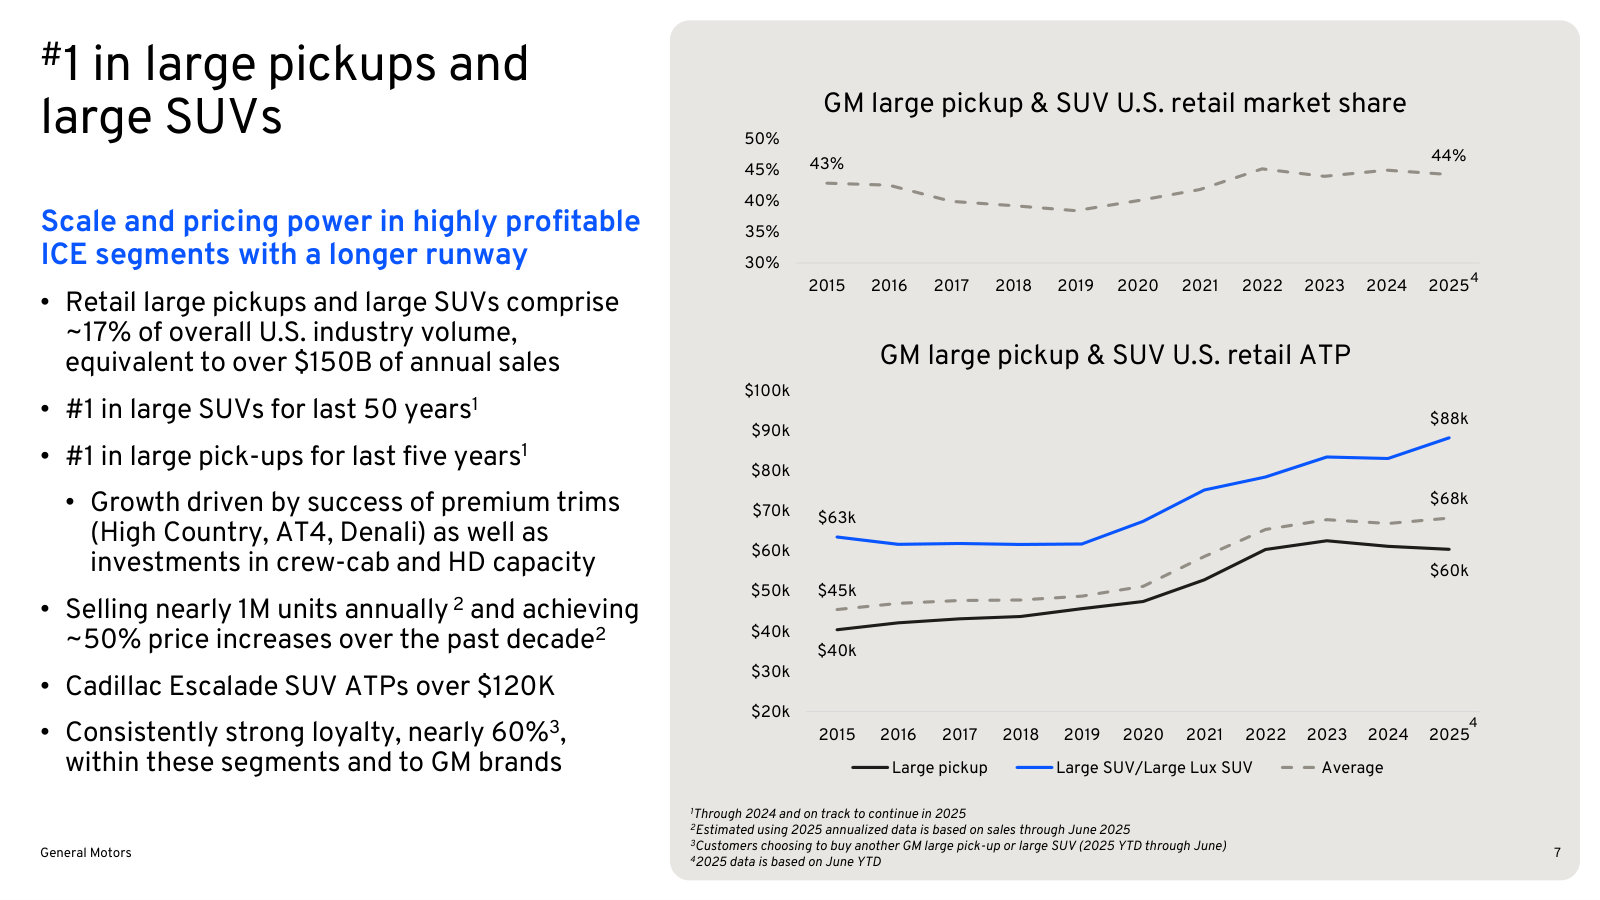
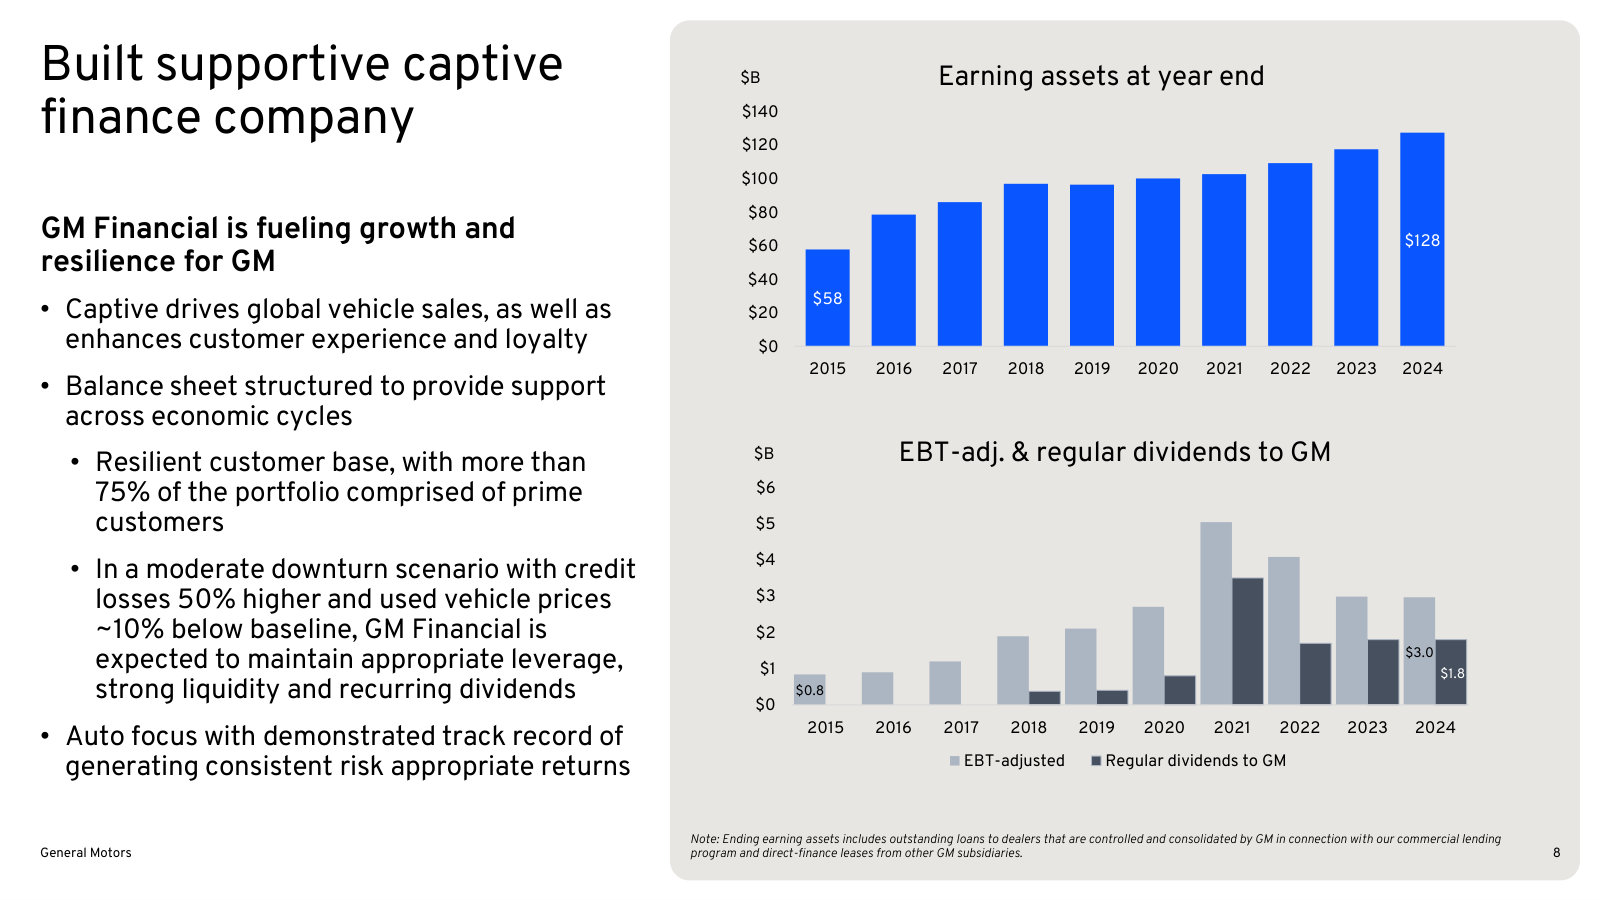
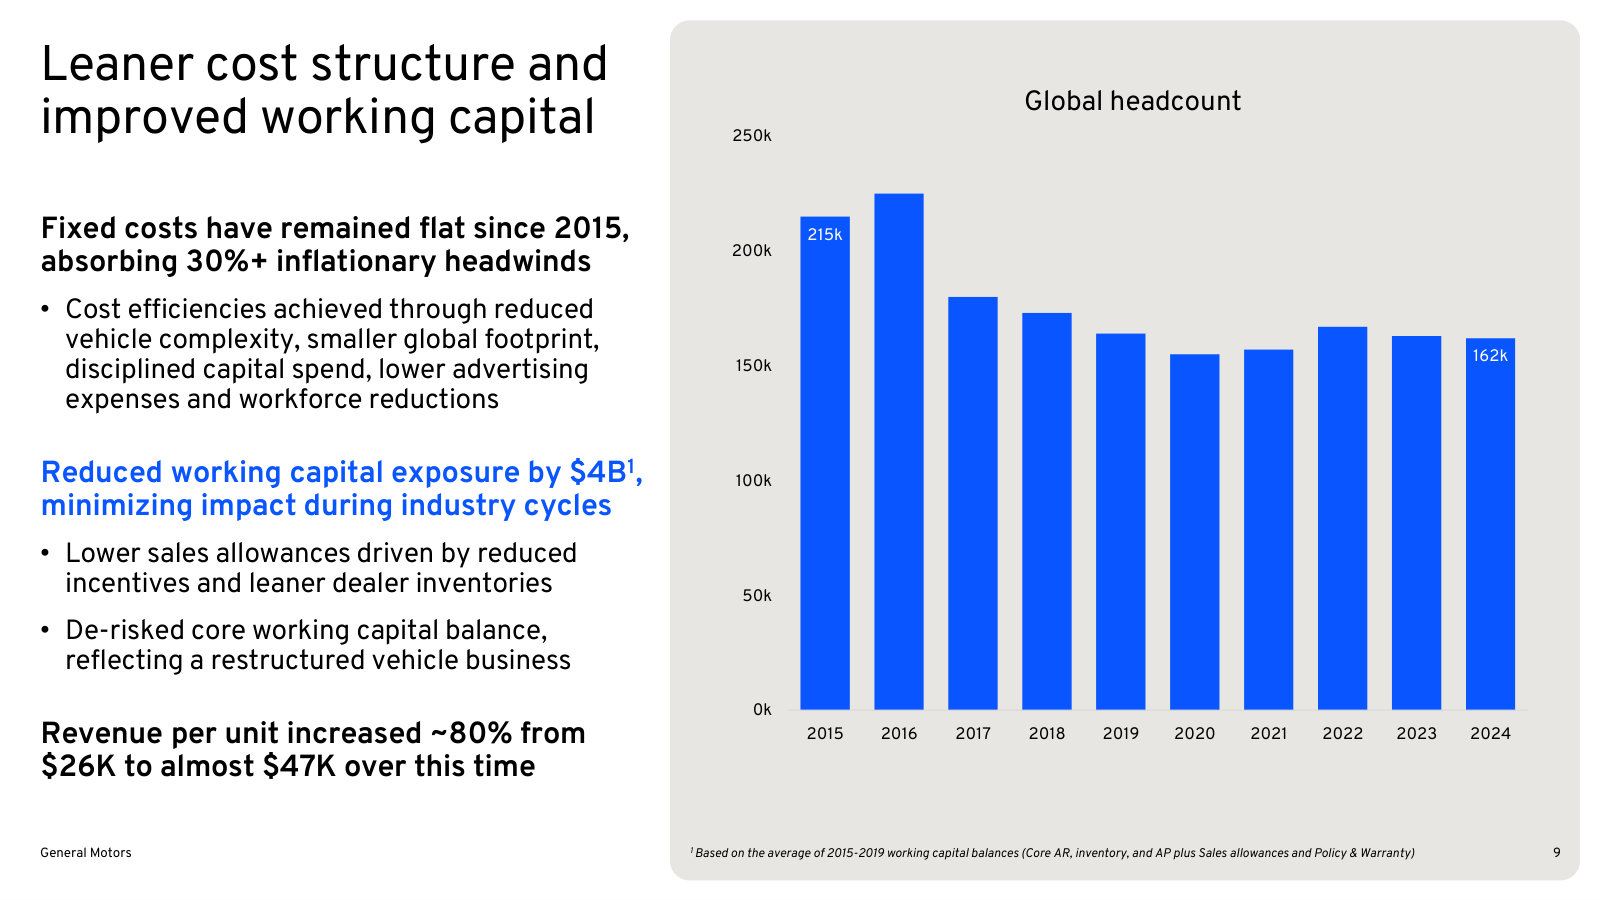
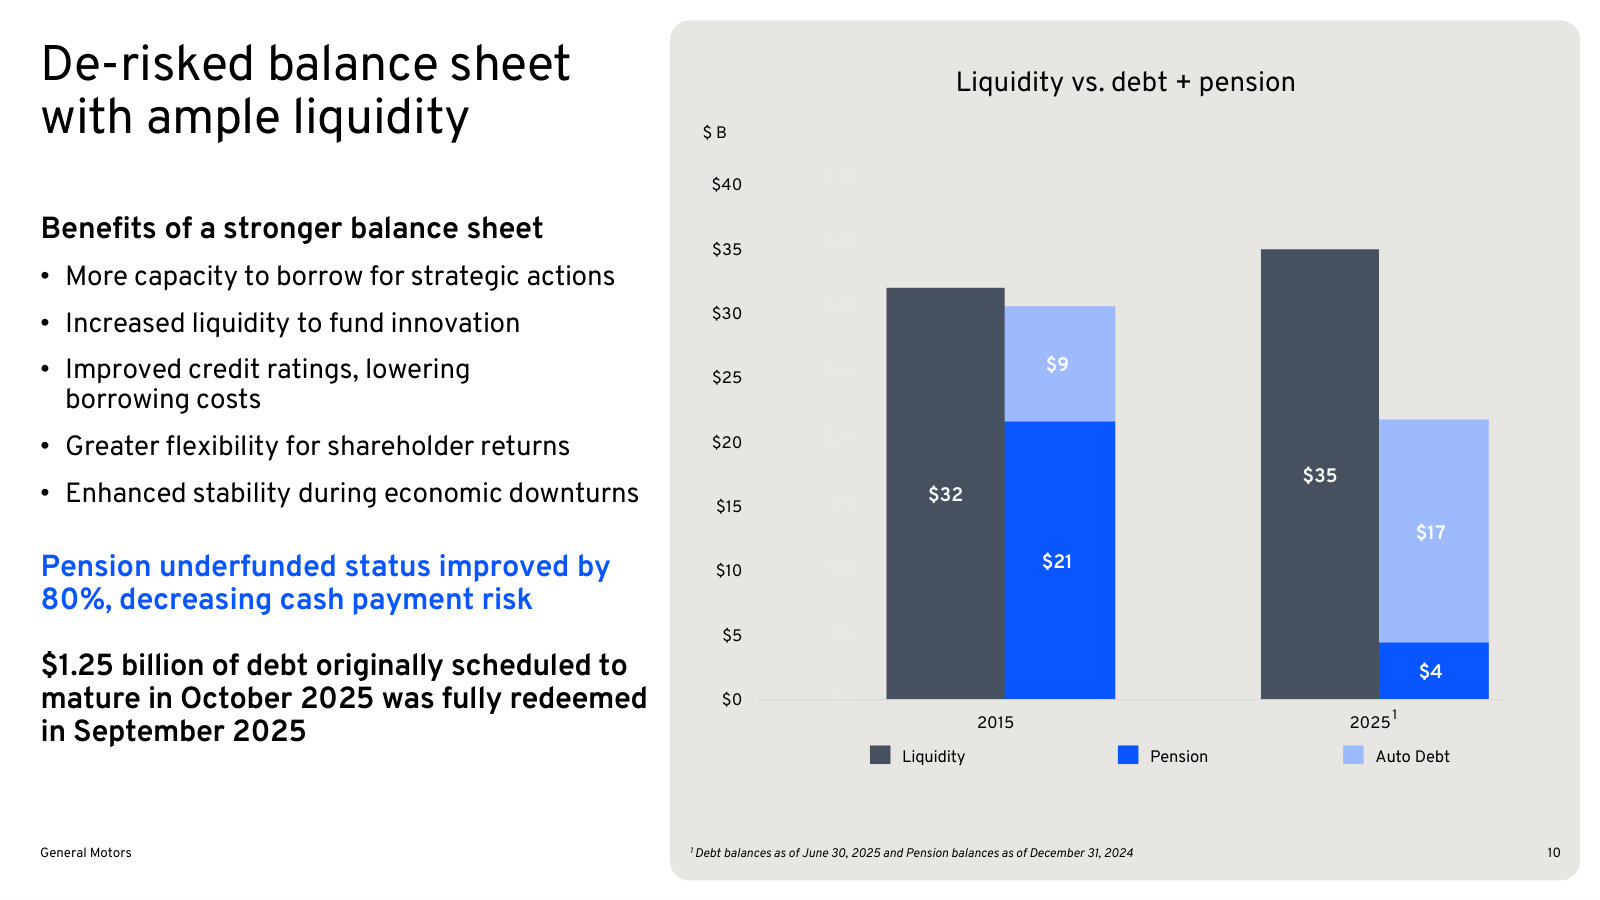
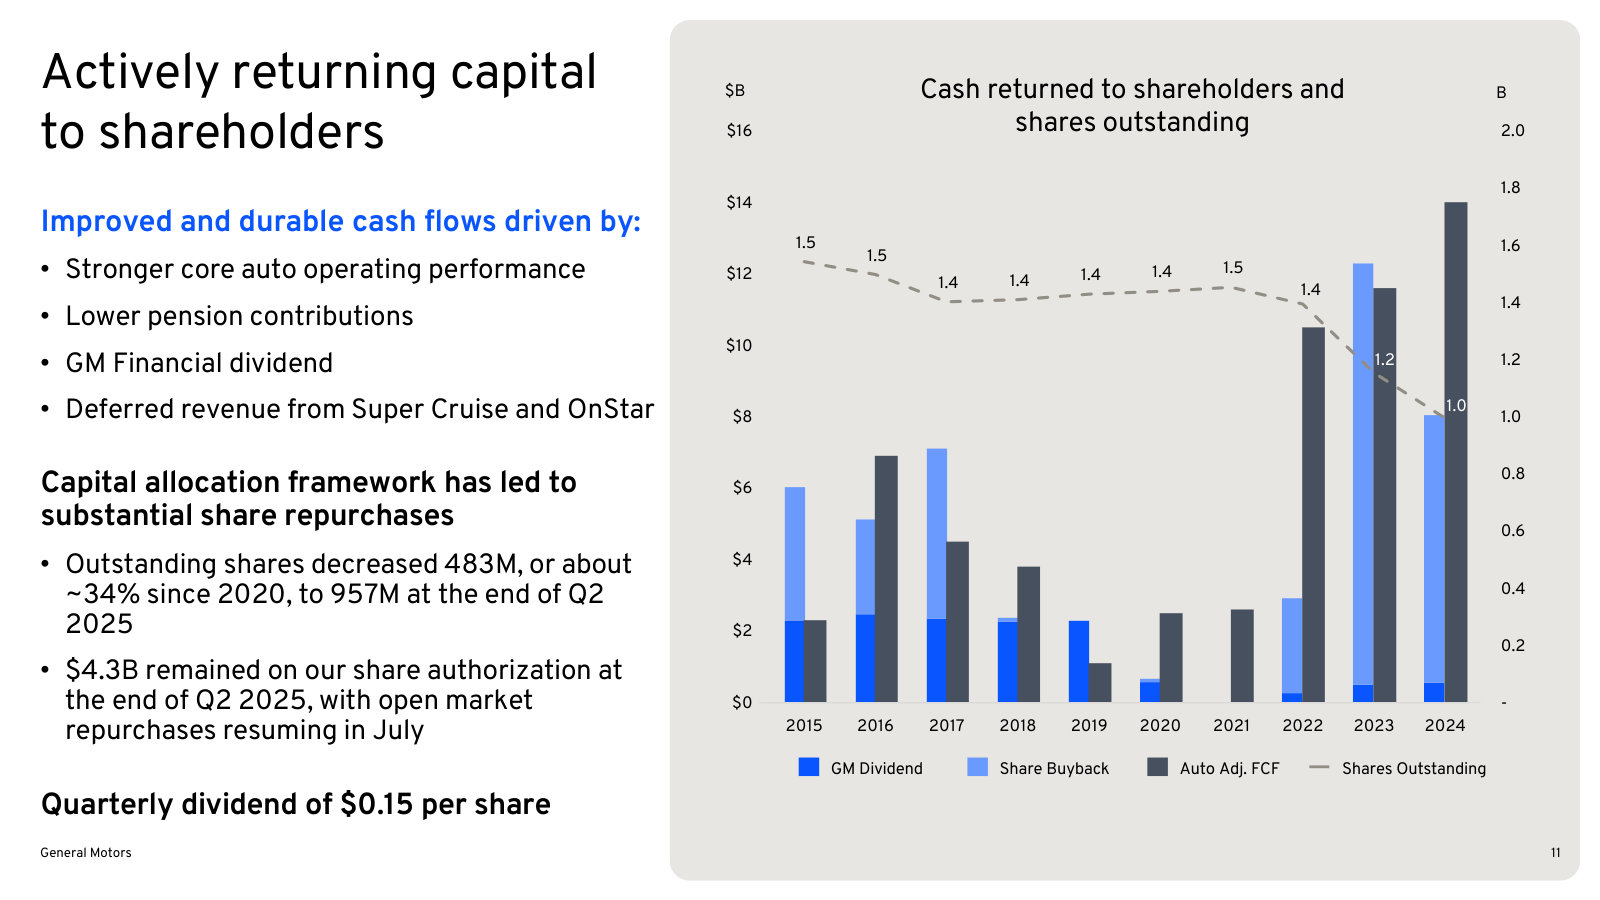
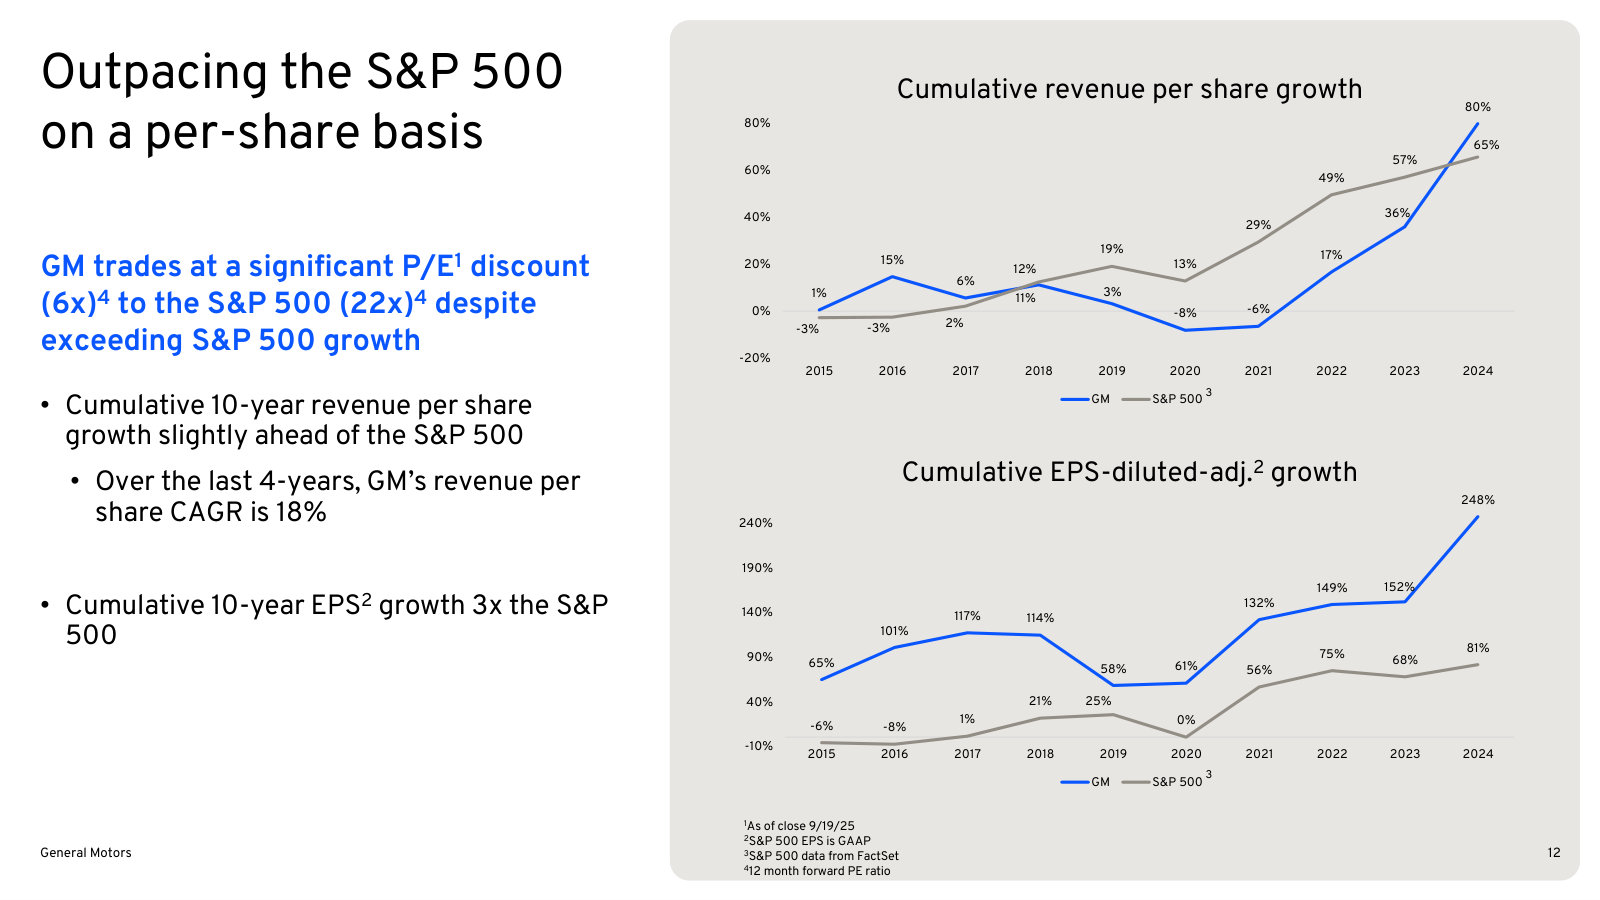
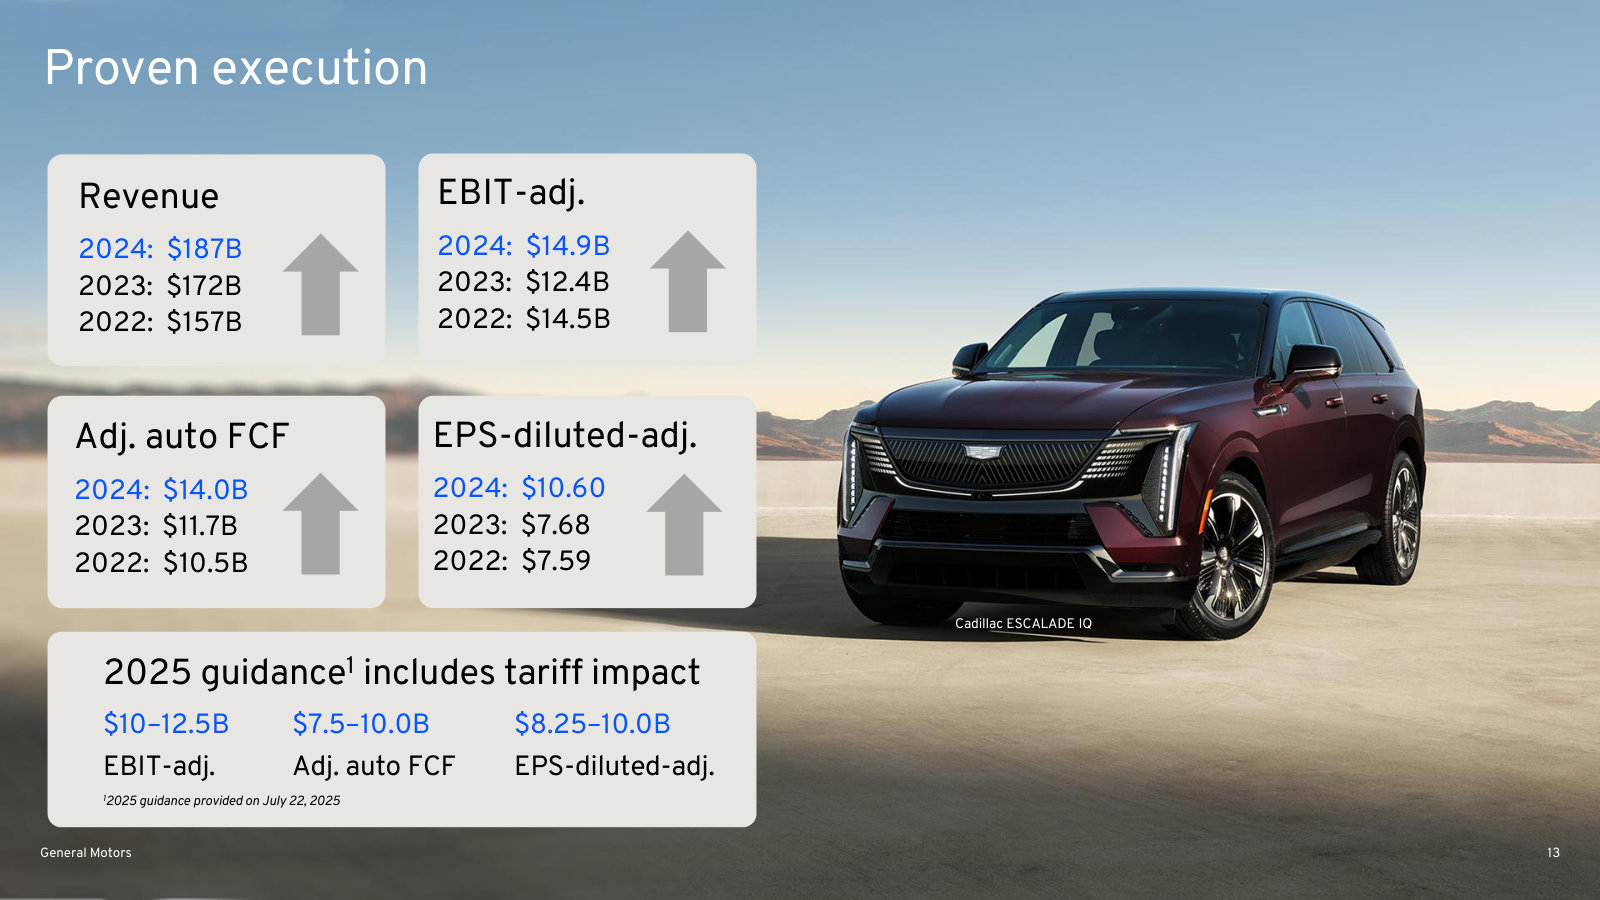
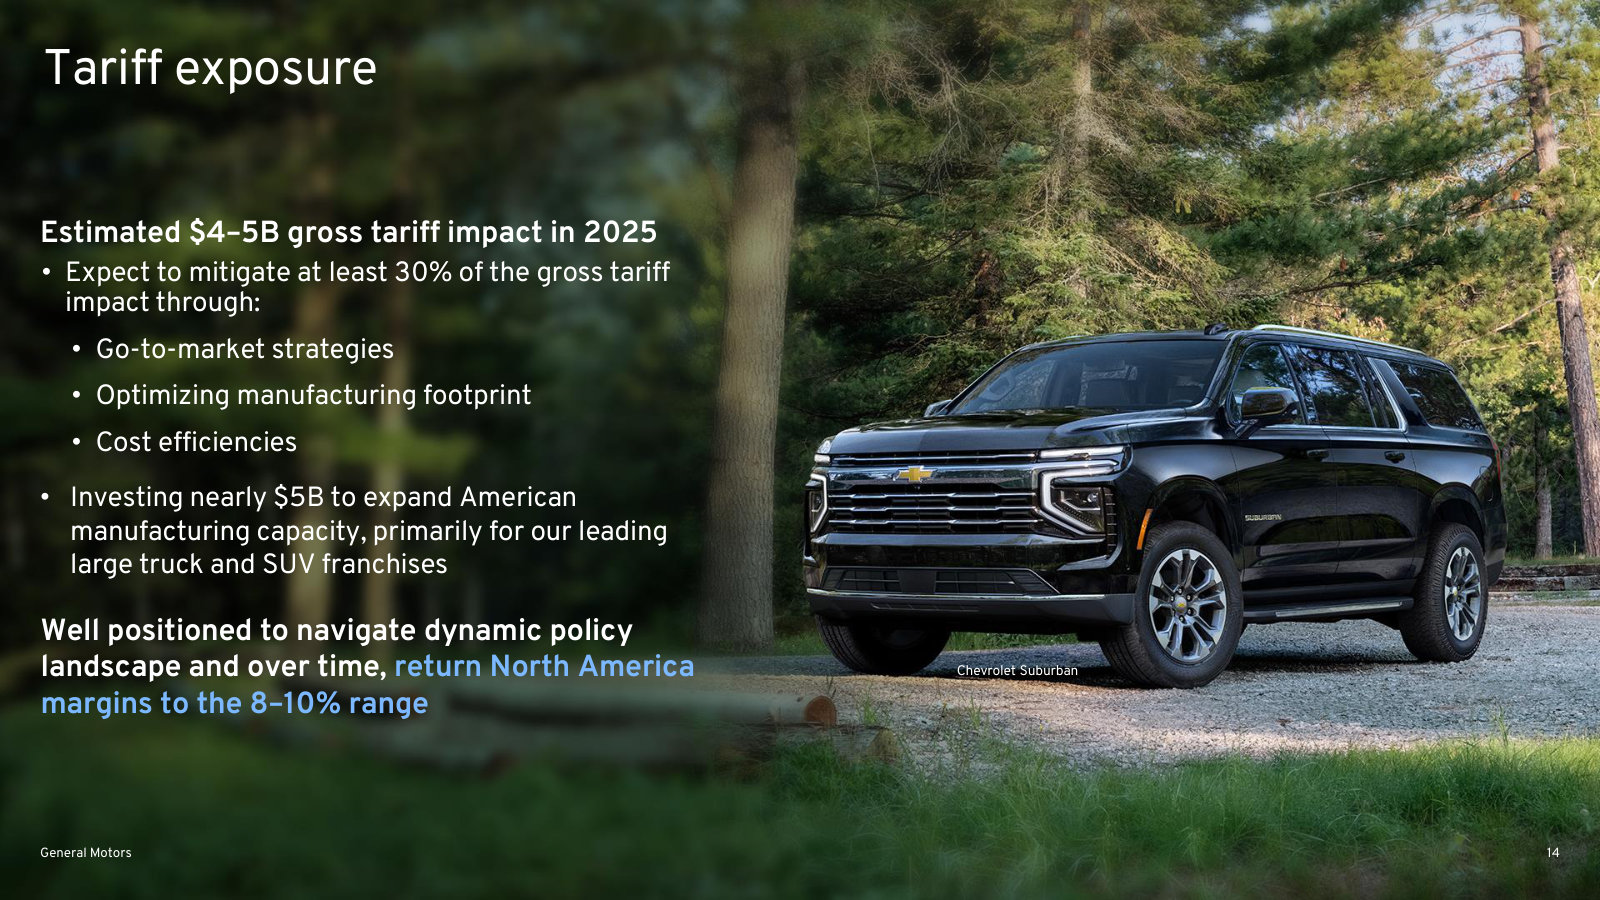
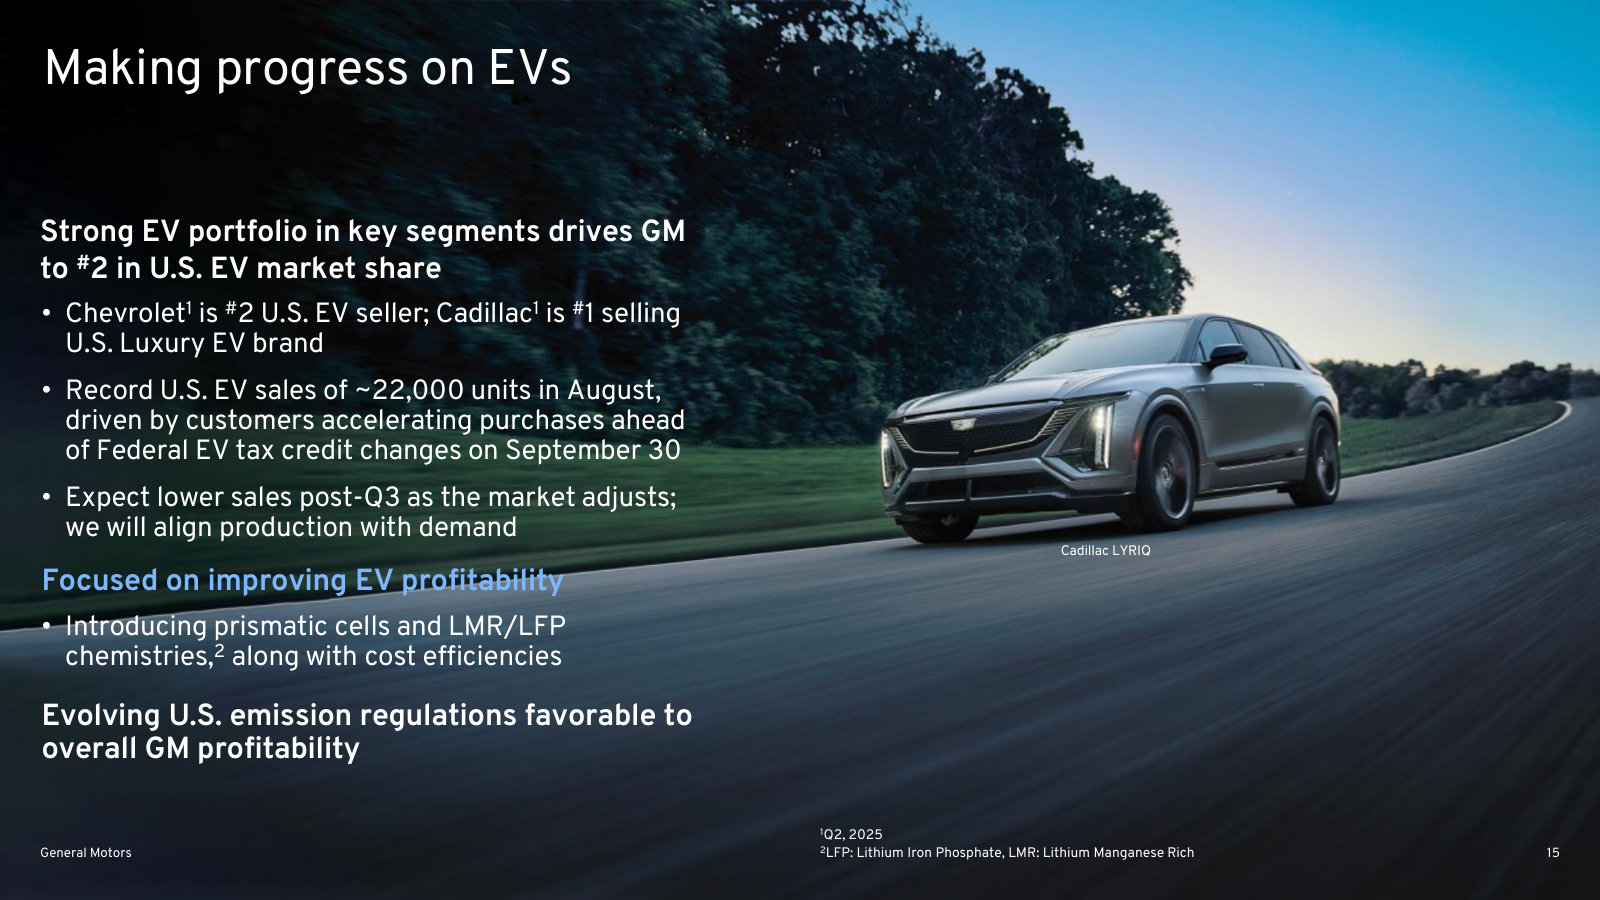
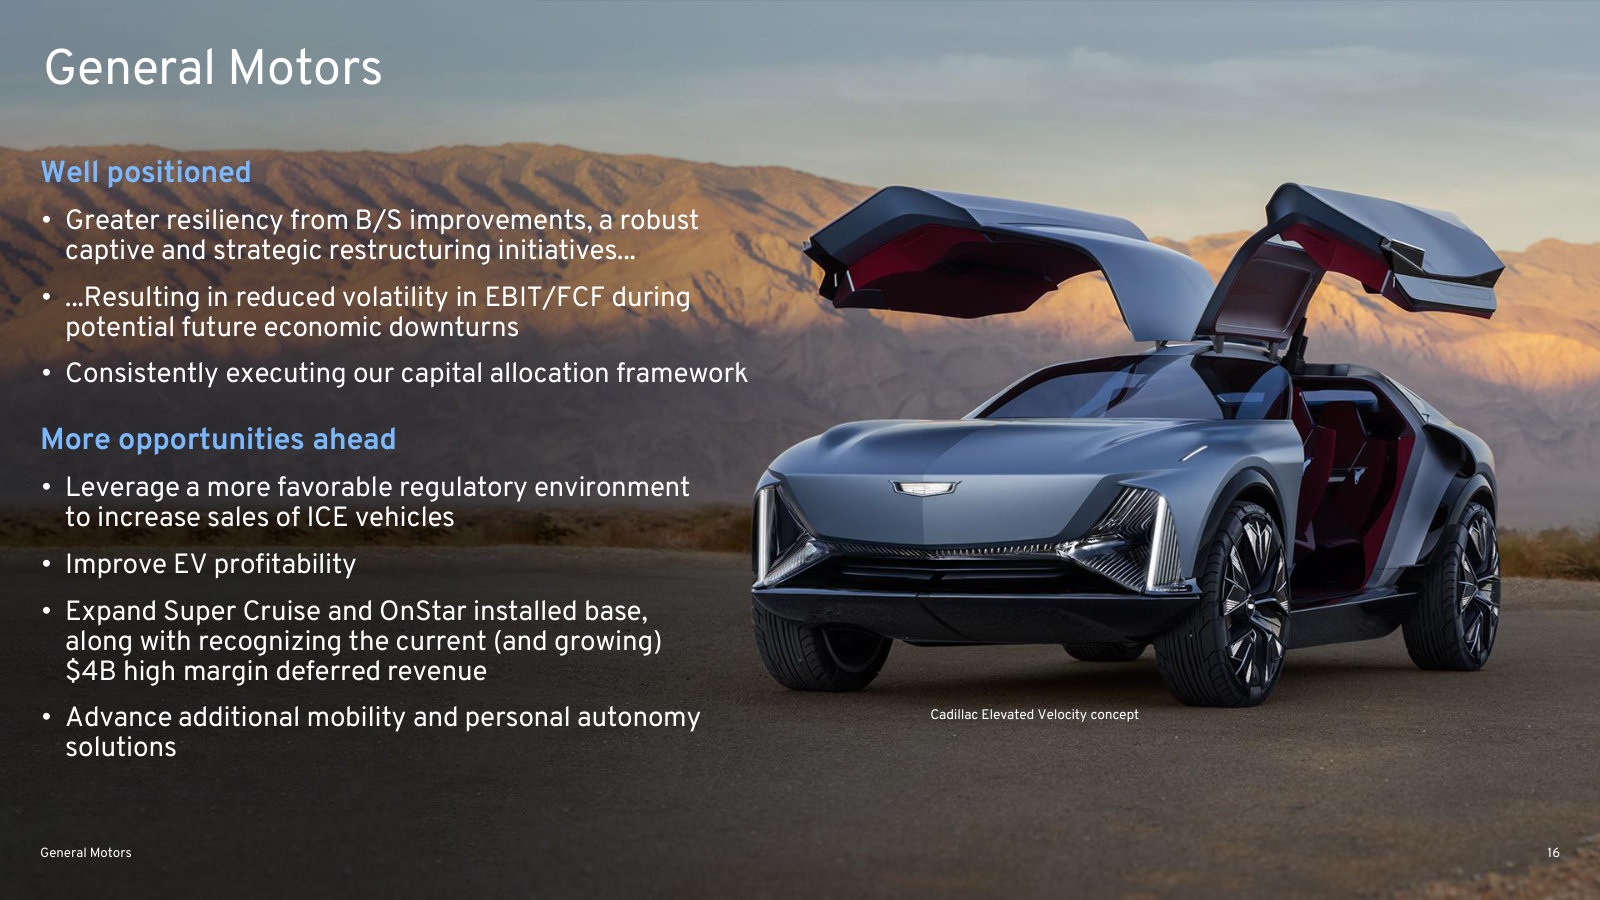
p. 4 — Where the extra ~$4B of EBIT since 2015 came from, by segment - North America and GM Financial up, China and Cruise down. · Open the full presentation →p. 5 — The markets GM left - Opel, India, Southeast Asia, Africa, Holden - and the resulting 84% North America revenue mix. · Open the full presentation →p. 6 — Inventory and incentive discipline against the industry; ~$1,500 lower incentives is worth ~$3.5B of EBIT a year. · Open the full presentation →p. 7 — The profit engine: 44% share of U.S. large pickups and SUVs, ~17% of industry volume, ATPs up ~50% in a decade. · Open the full presentation →p. 8 — GM Financial in two charts - $128B of earning assets and the pre-tax profit and dividends it sends the parent. · Open the full presentation →p. 9 — Fixed costs flat since 2015 against 30% inflation, headcount down from 215k to 162k, revenue per unit up ~80%. · Open the full presentation →p. 10 — Liquidity against debt and pension, 2015 versus 2025 - the pension shortfall down 80%. · Open the full presentation →p. 11 — The capital allocation record: dividends, buybacks and free cash flow, with share count falling from 1.5B to 1.0B. · Open the full presentation →p. 12 — GM's own valuation argument - per-share growth ahead of the S&P 500 at roughly a third of the multiple. · Open the full presentation →p. 13 — Three years of revenue, EBIT-adj., free cash flow and EPS, plus what 2025 guidance assumed after tariffs. · Open the full presentation →p. 14 — Tariff exposure as management framed it in 2025: $4-5B gross, at least 30% mitigated, $5B of new U.S. capacity. · Open the full presentation →p. 15 — Where the EV business stood - #2 in U.S. share, with cell chemistry changes aimed at closing the profit gap. · Open the full presentation →p. 16 — The closing case: what management thinks makes earnings durable and where the next dollar of growth comes from. · Open the full presentation →
The most recent quarter: current segment economics, the cost of the EV wind-down, and the 2026 guidance now in force. · Open the full document →
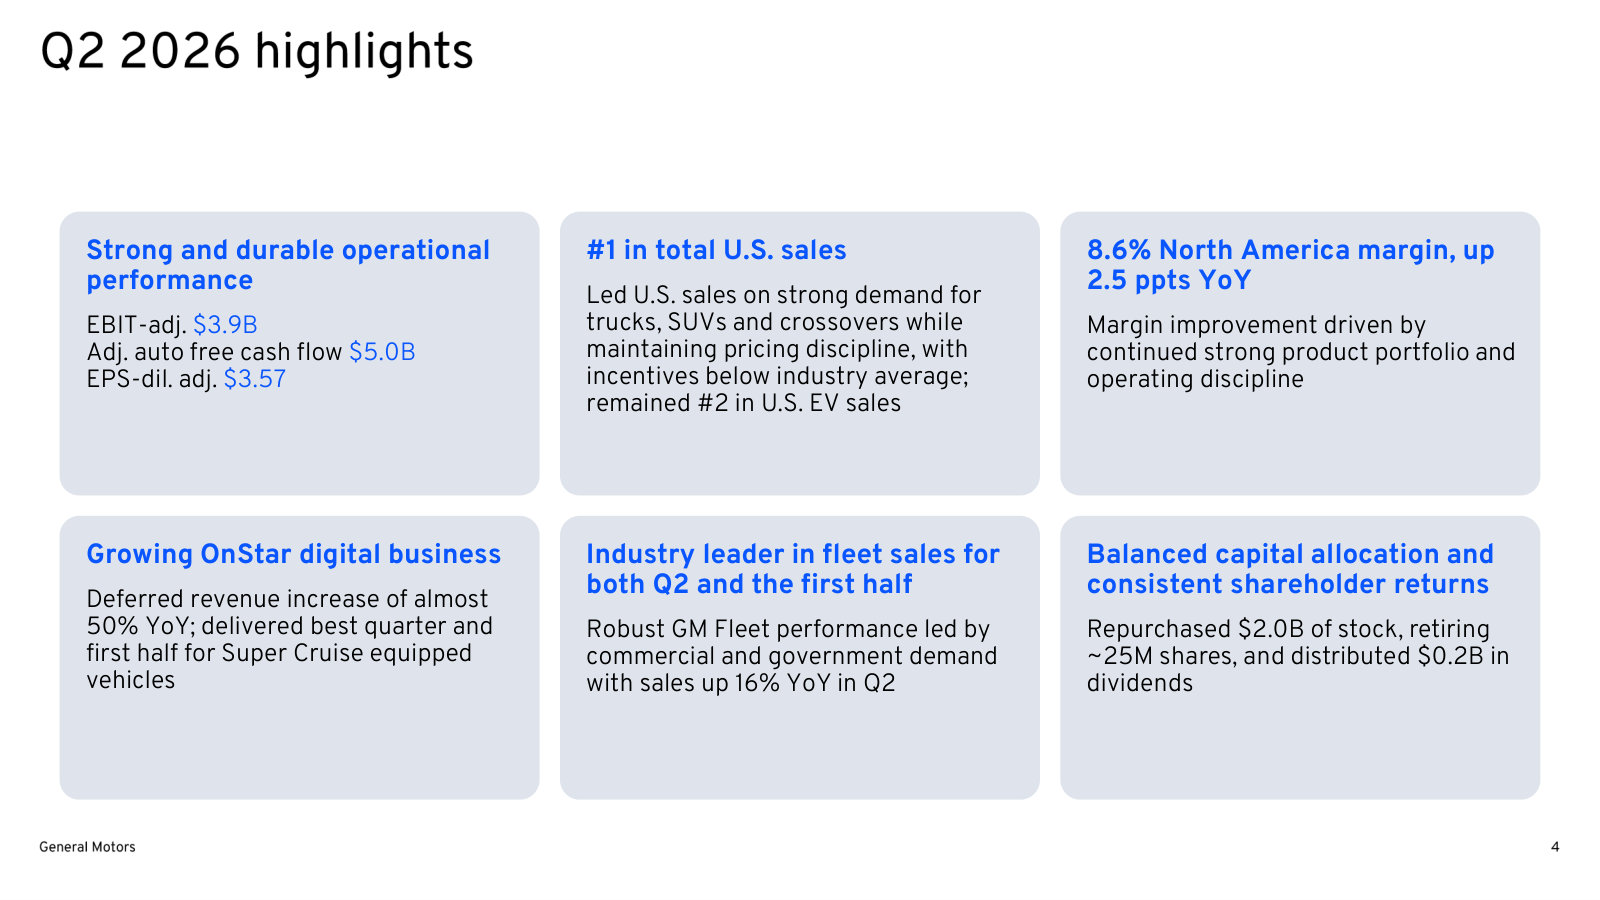
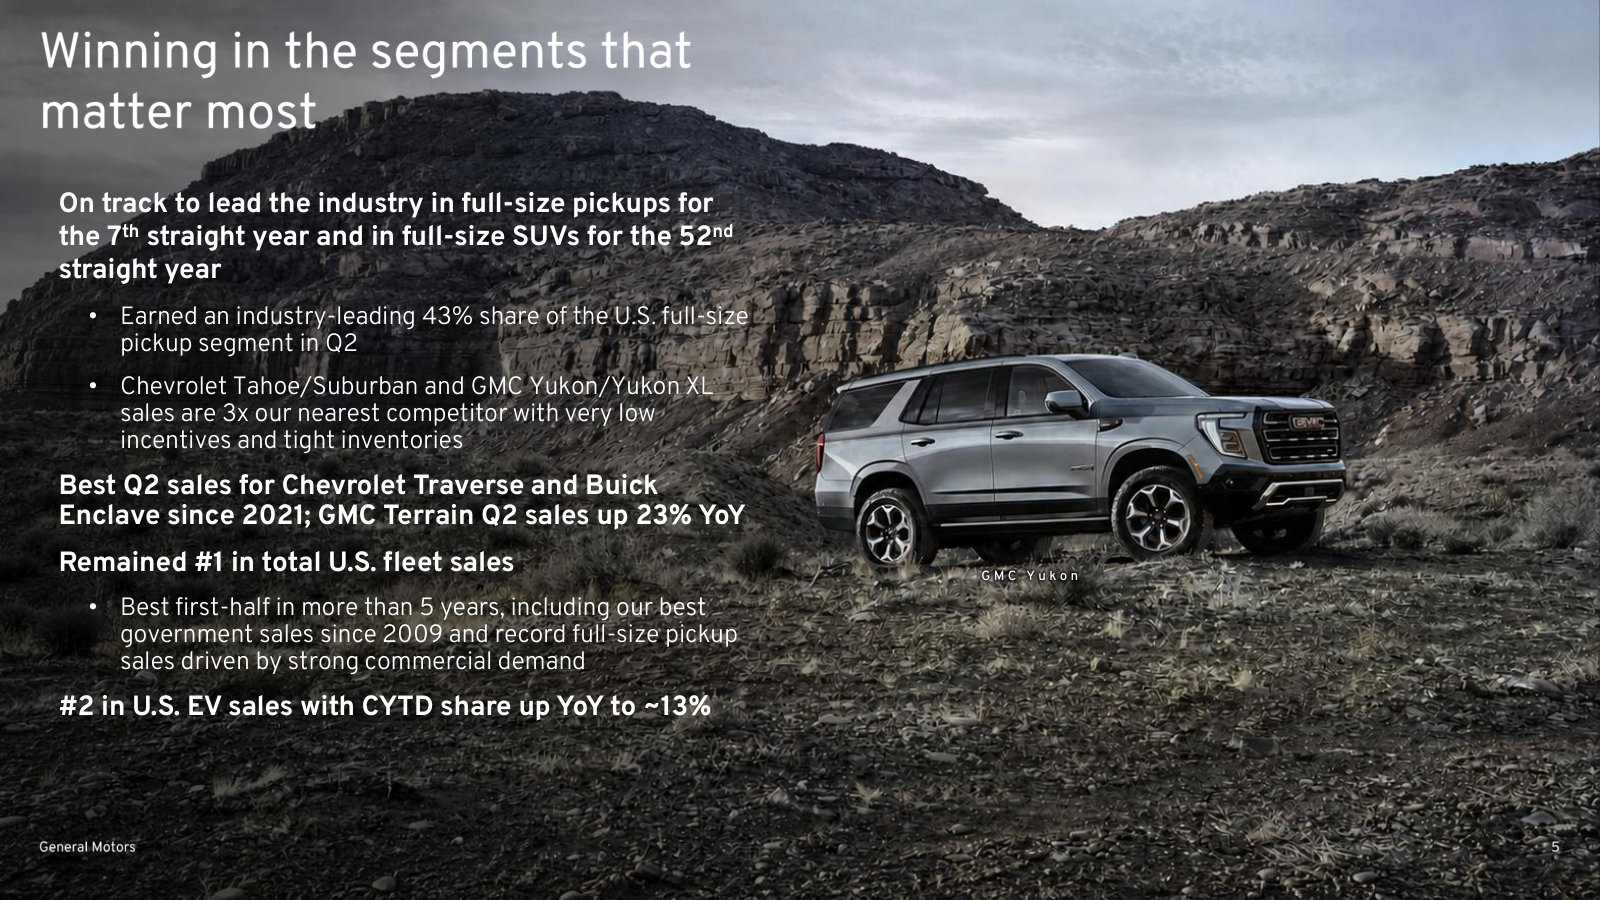
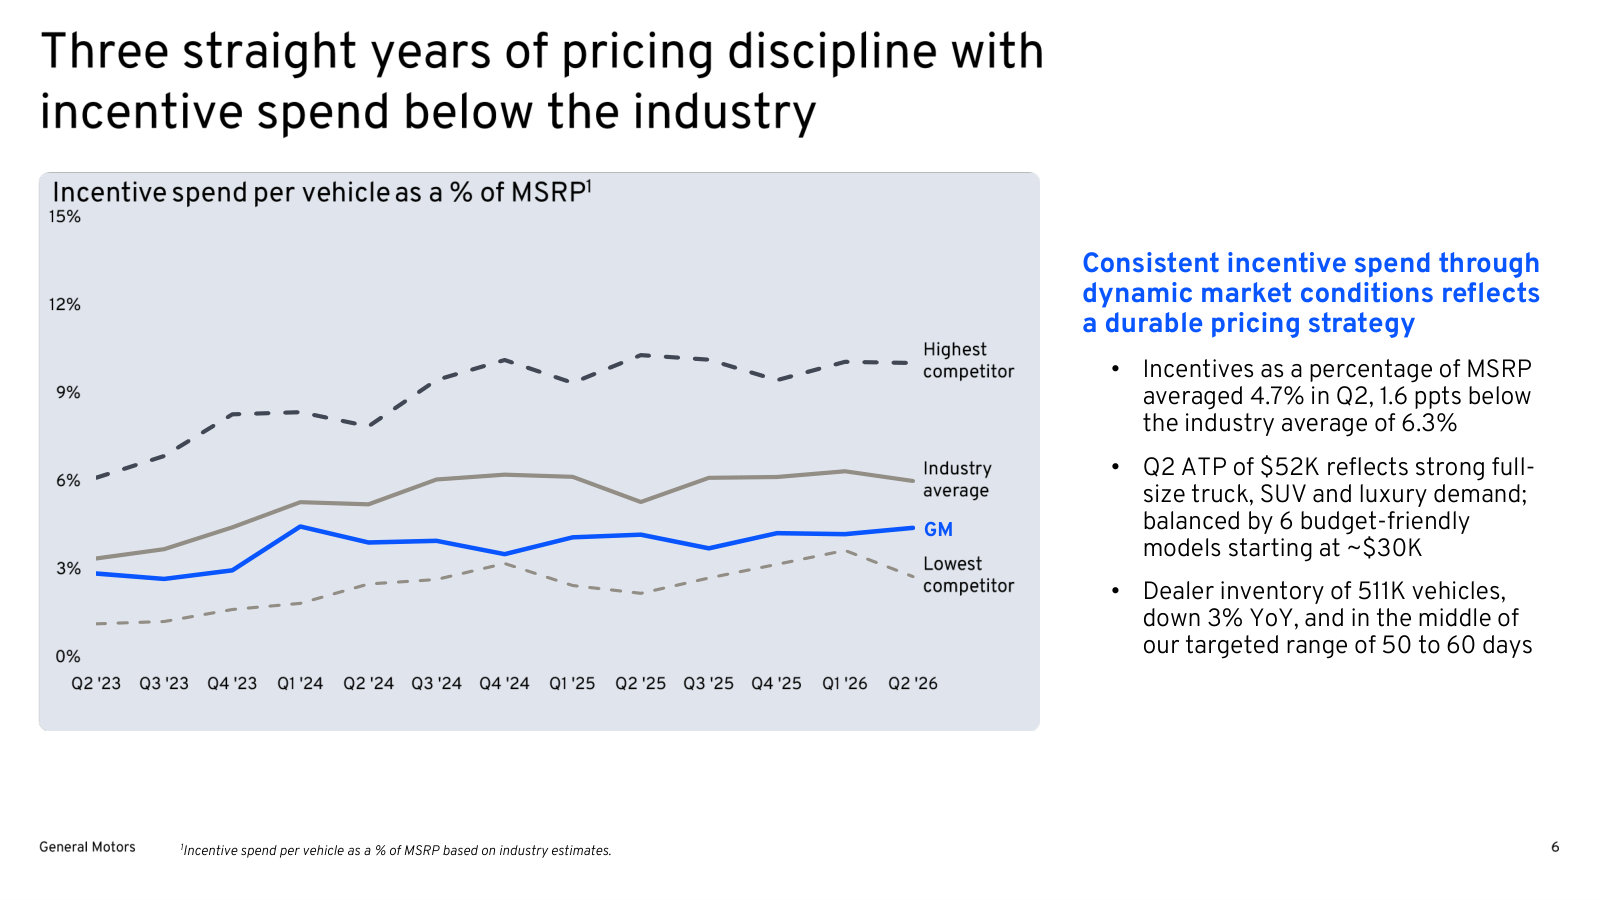
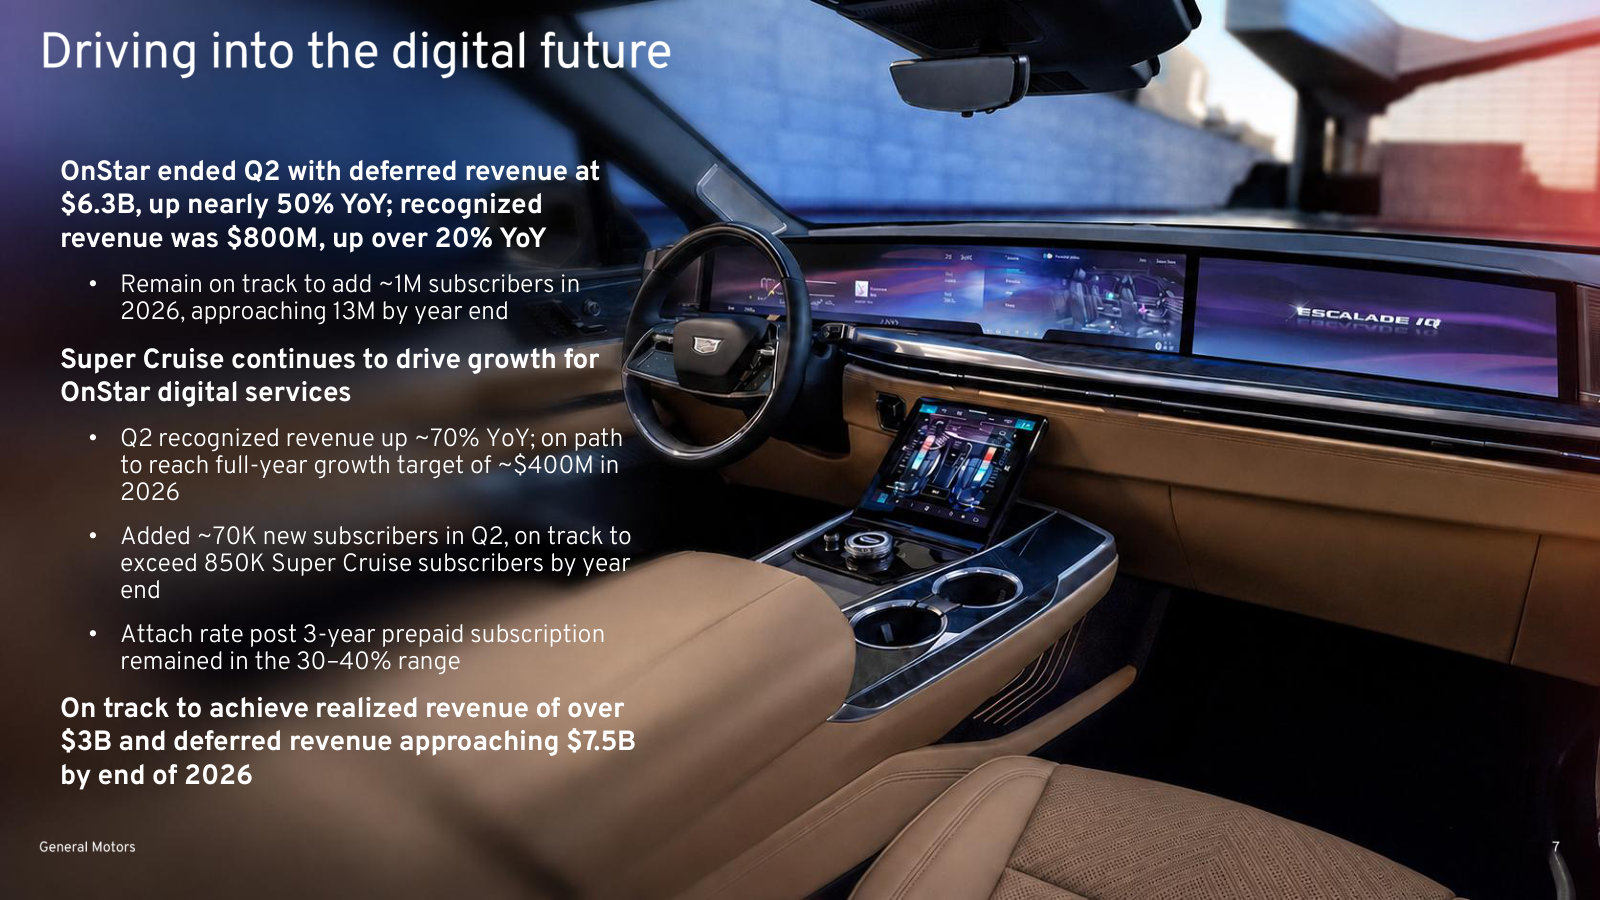
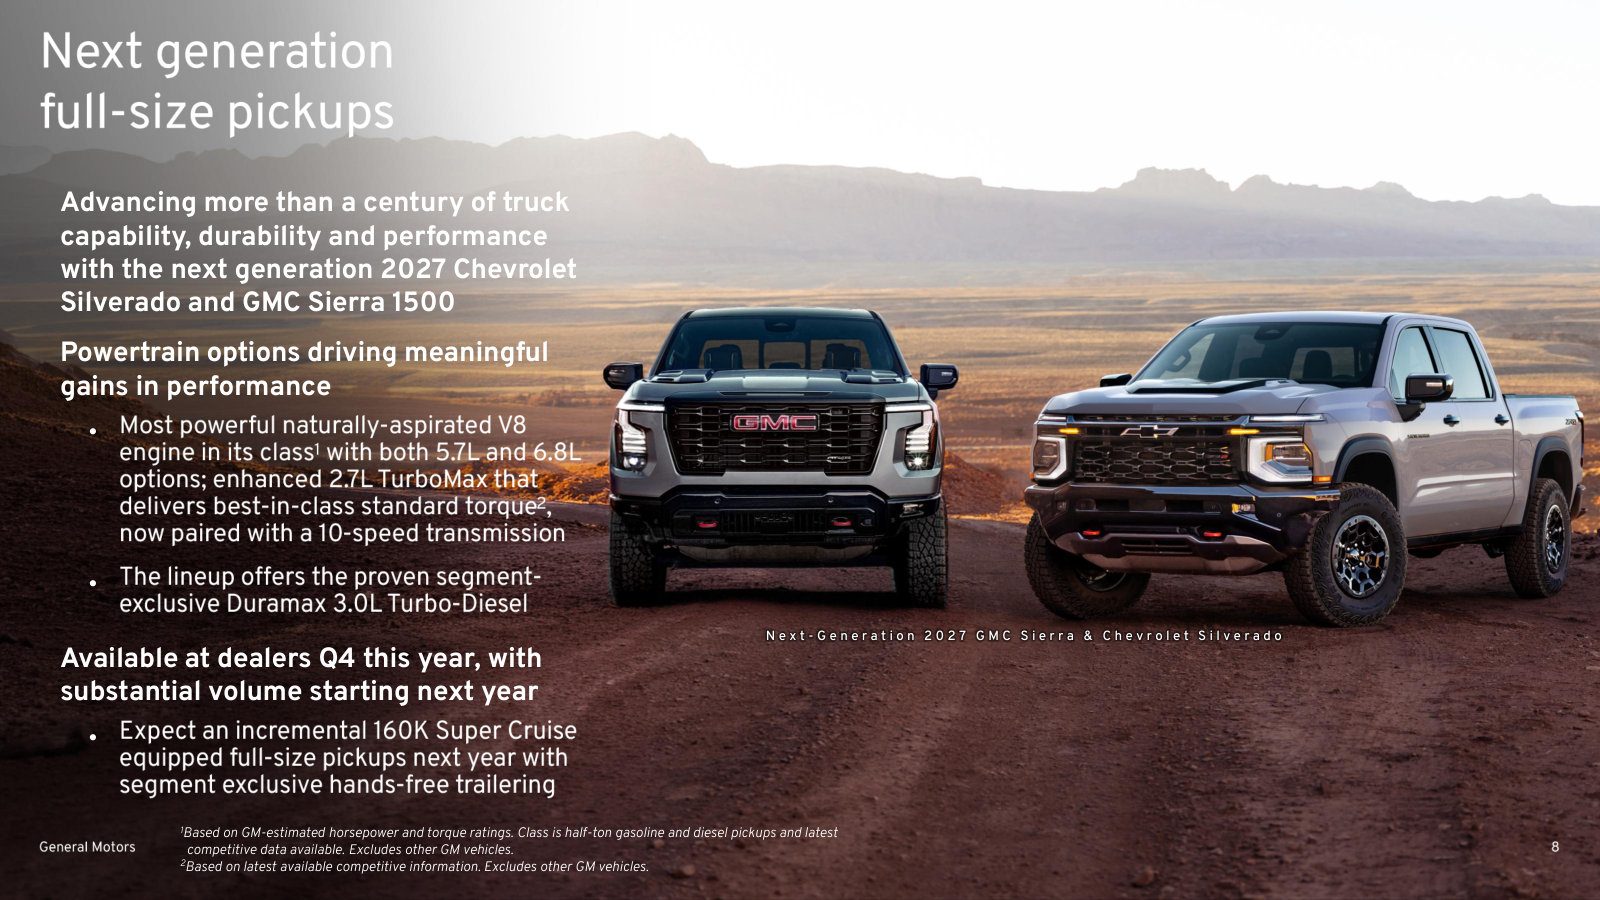
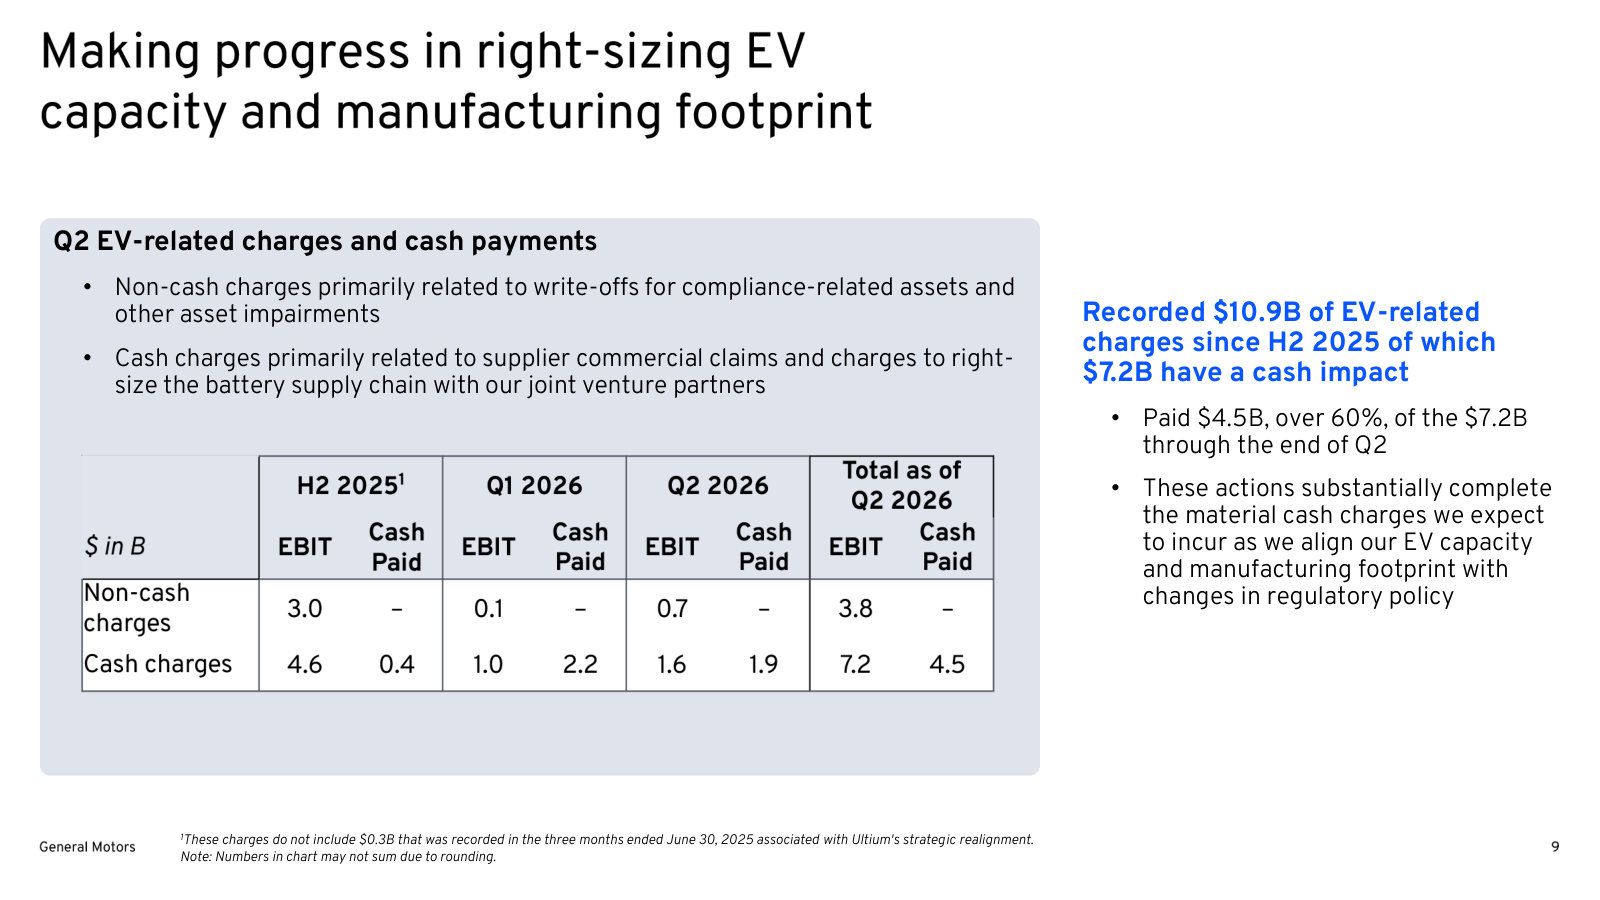
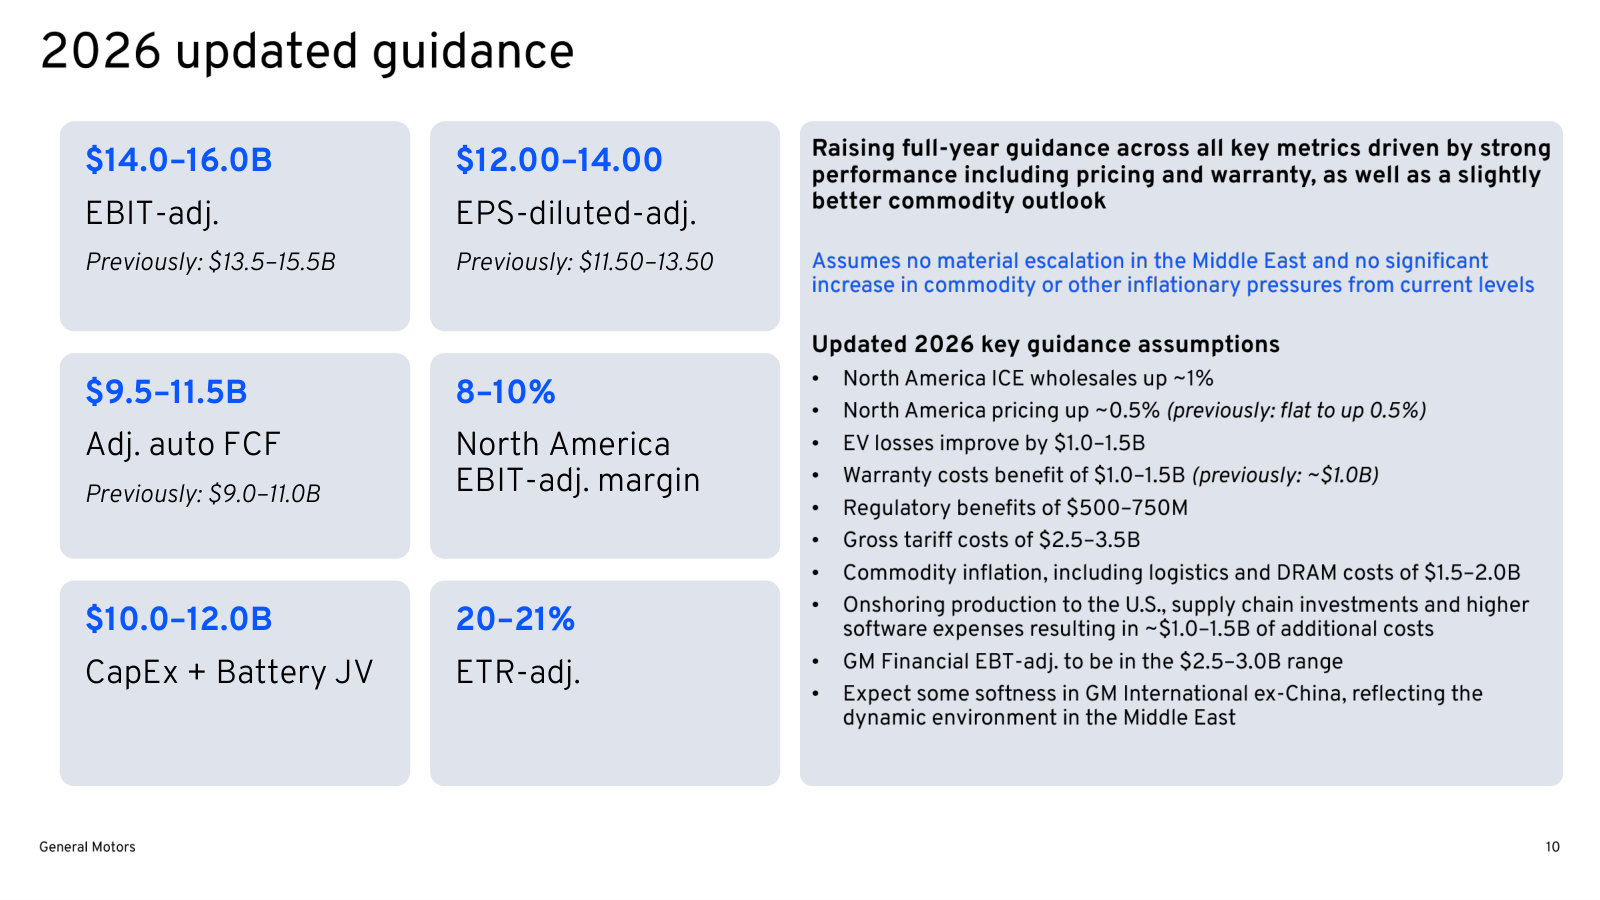
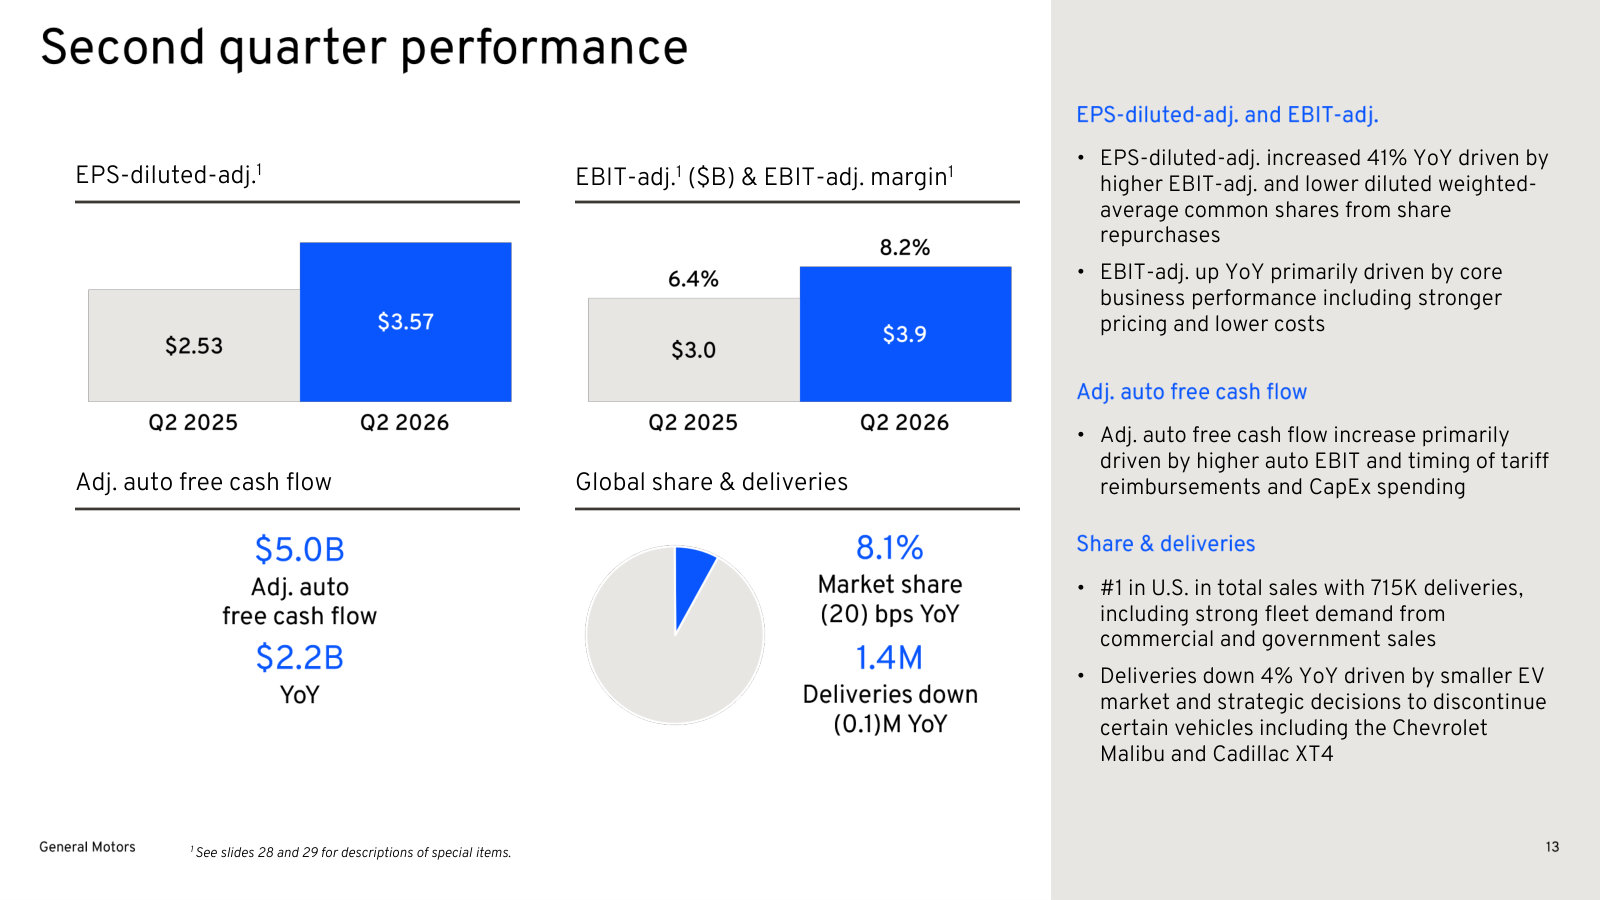
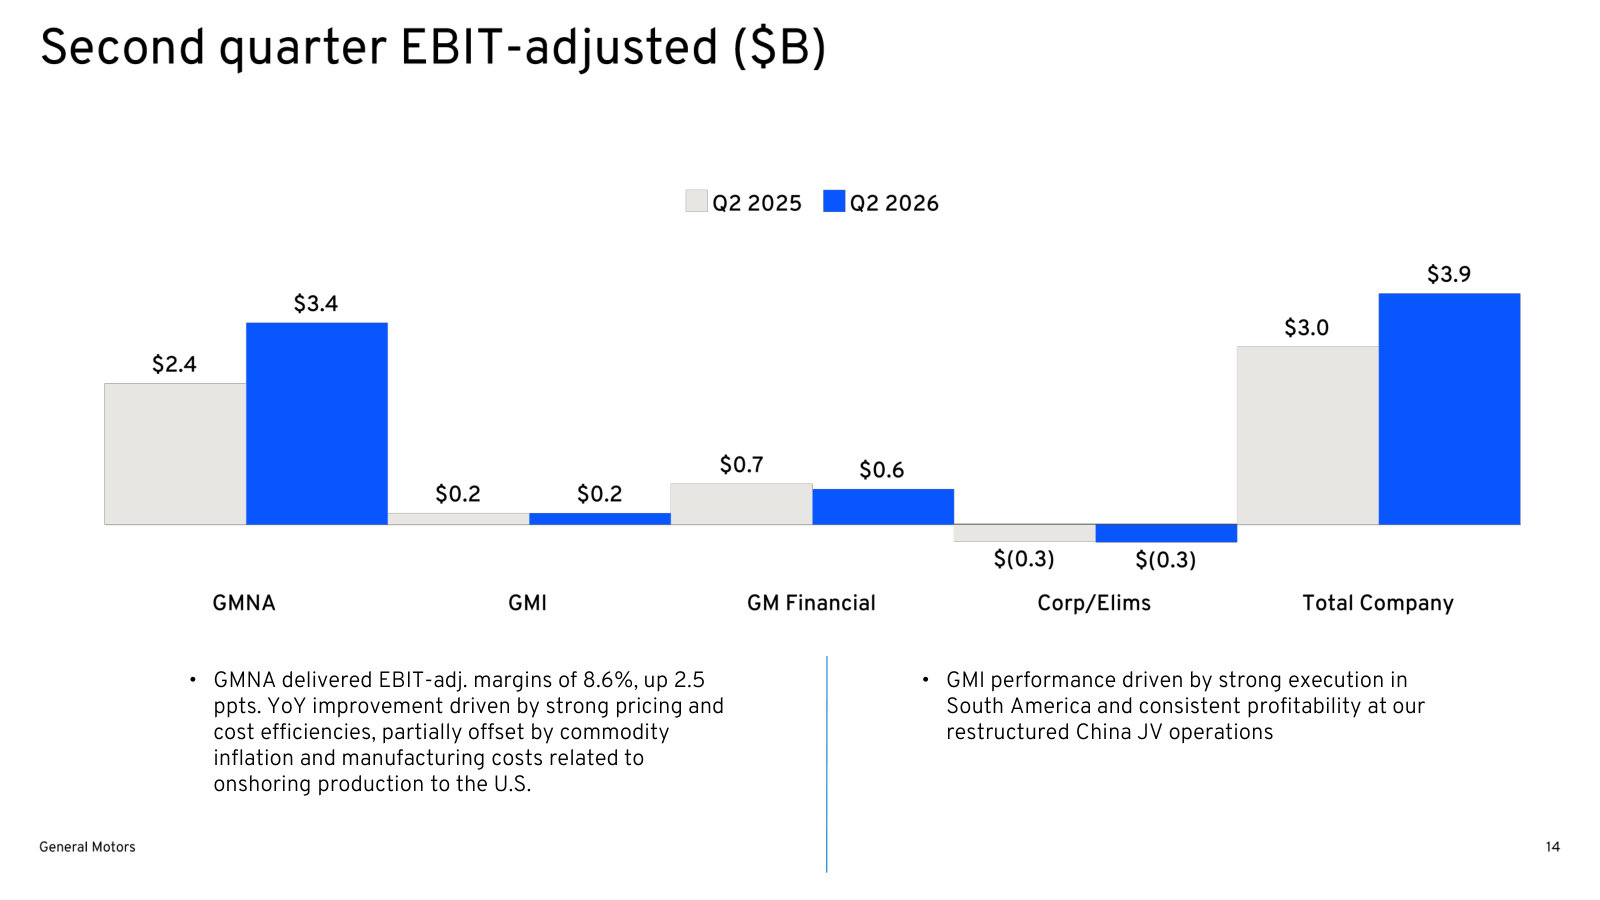
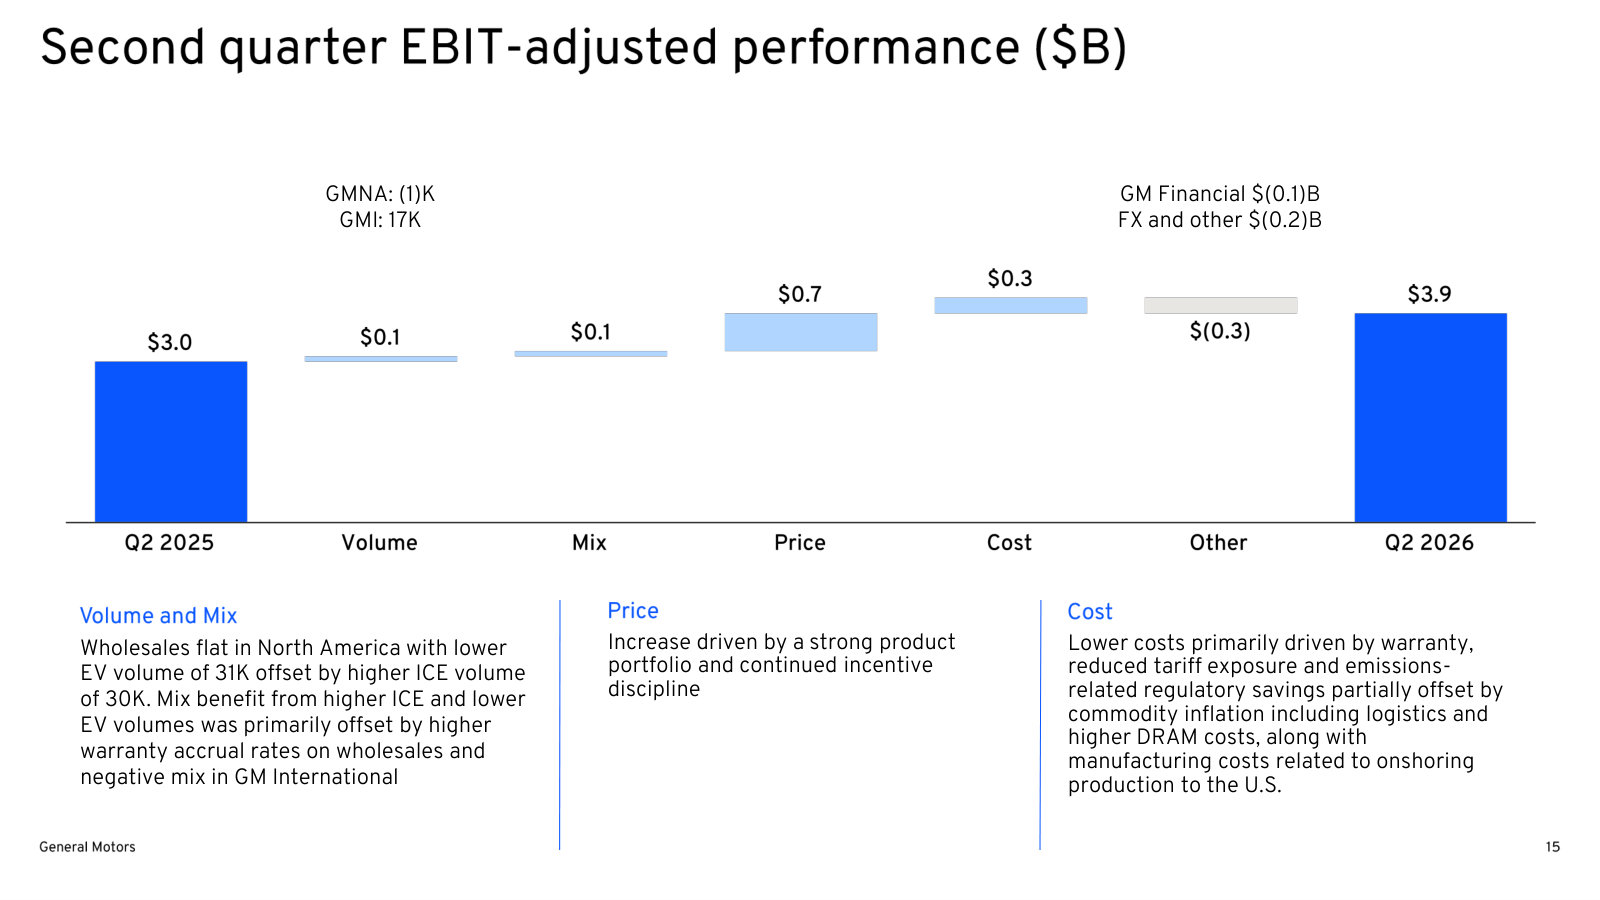
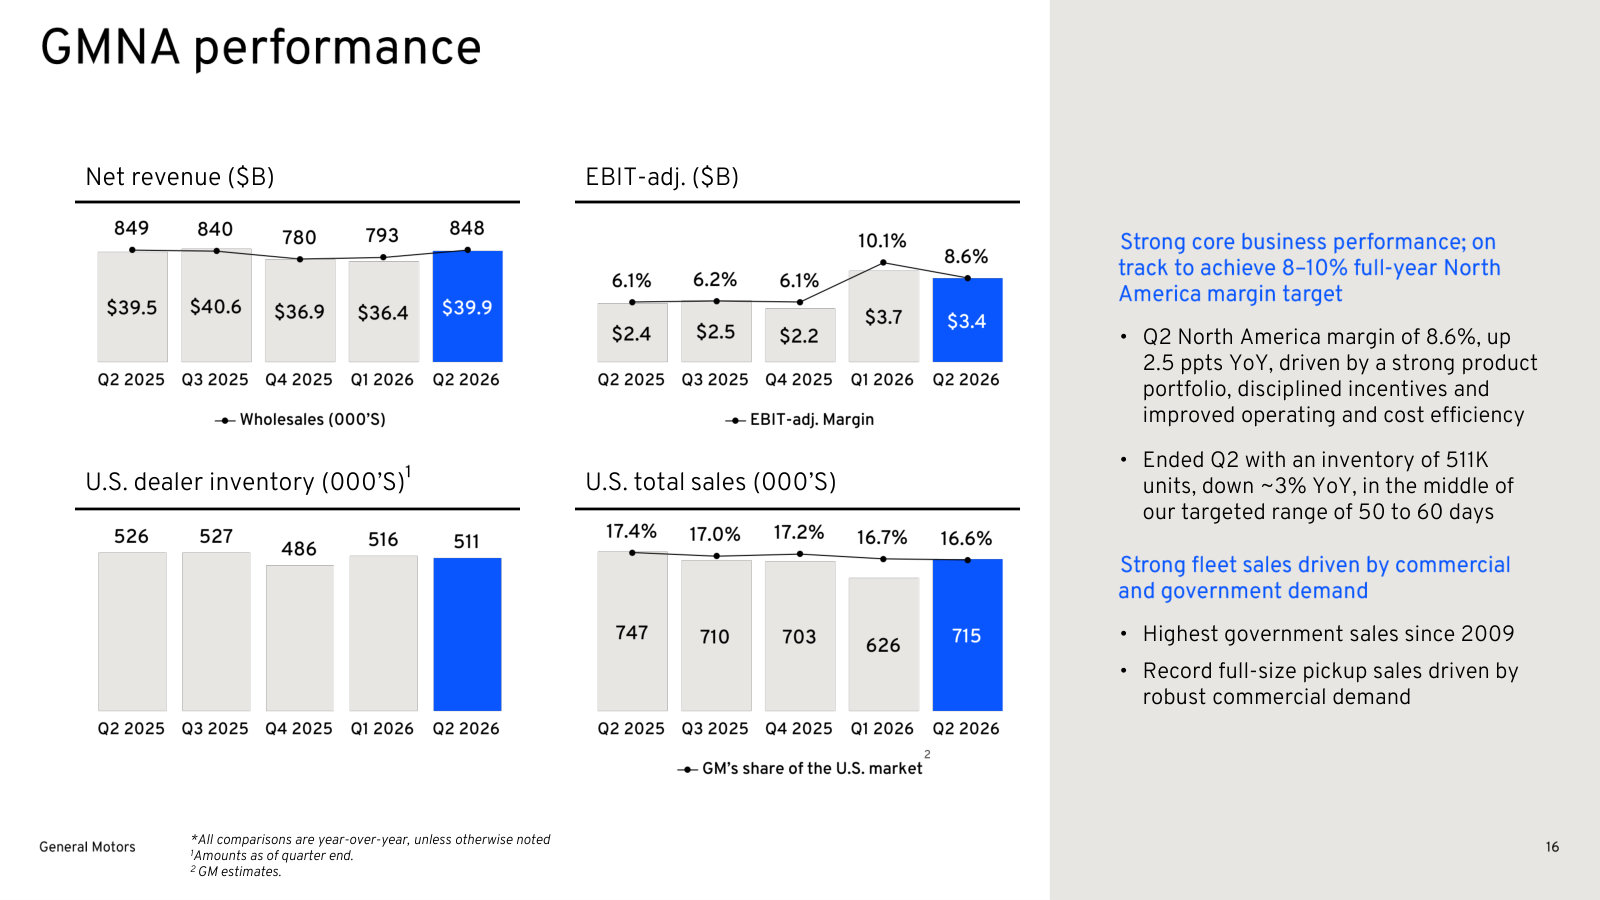
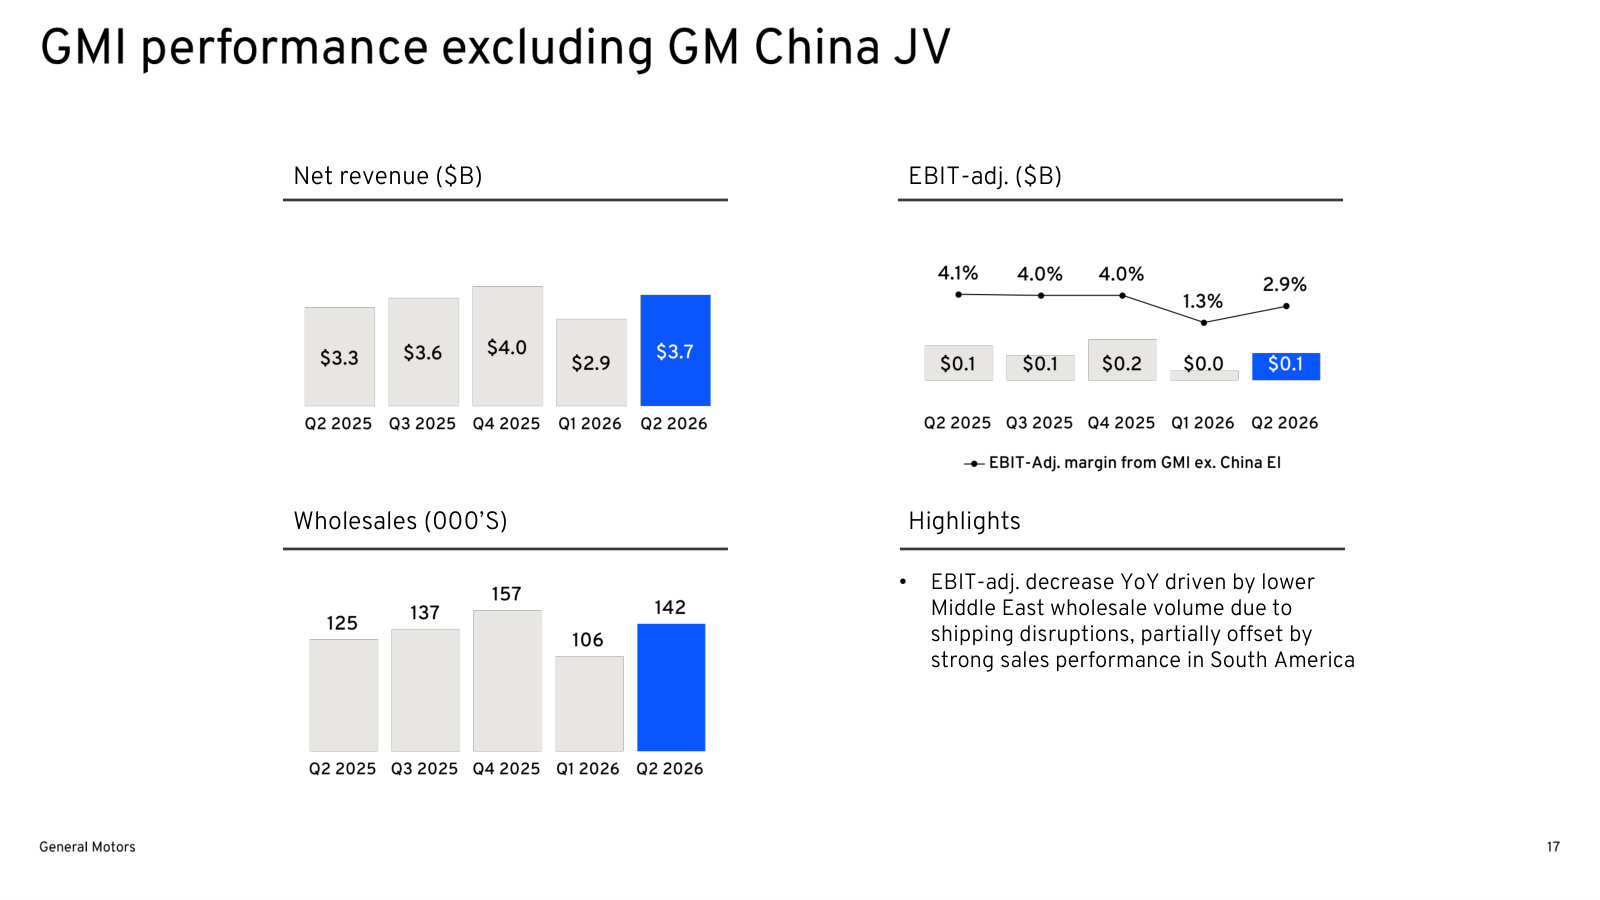
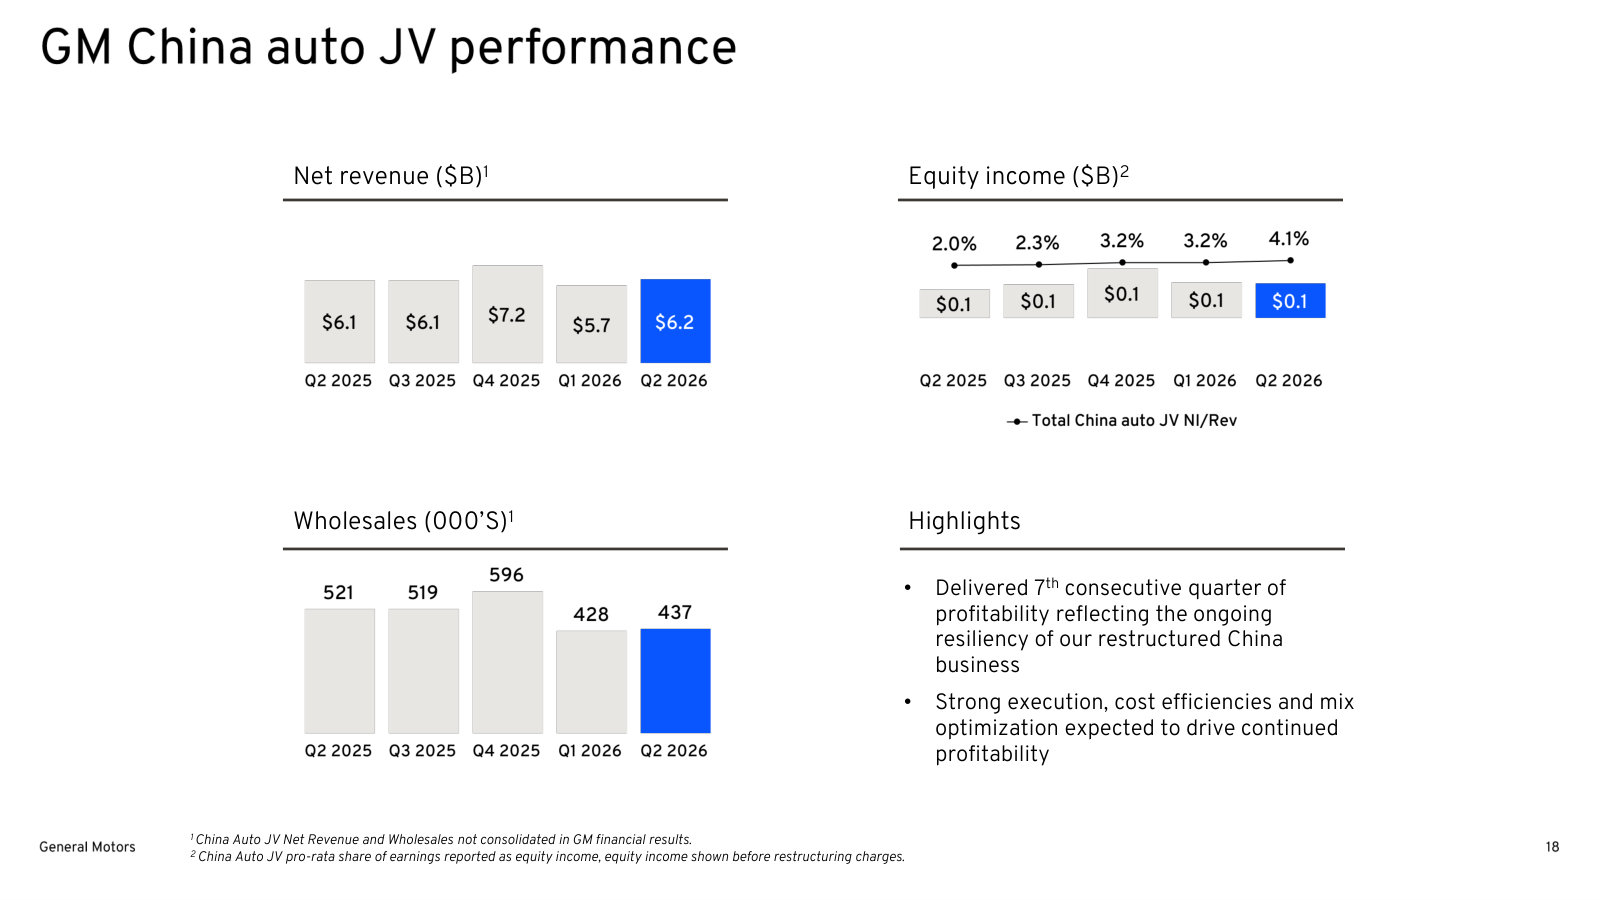
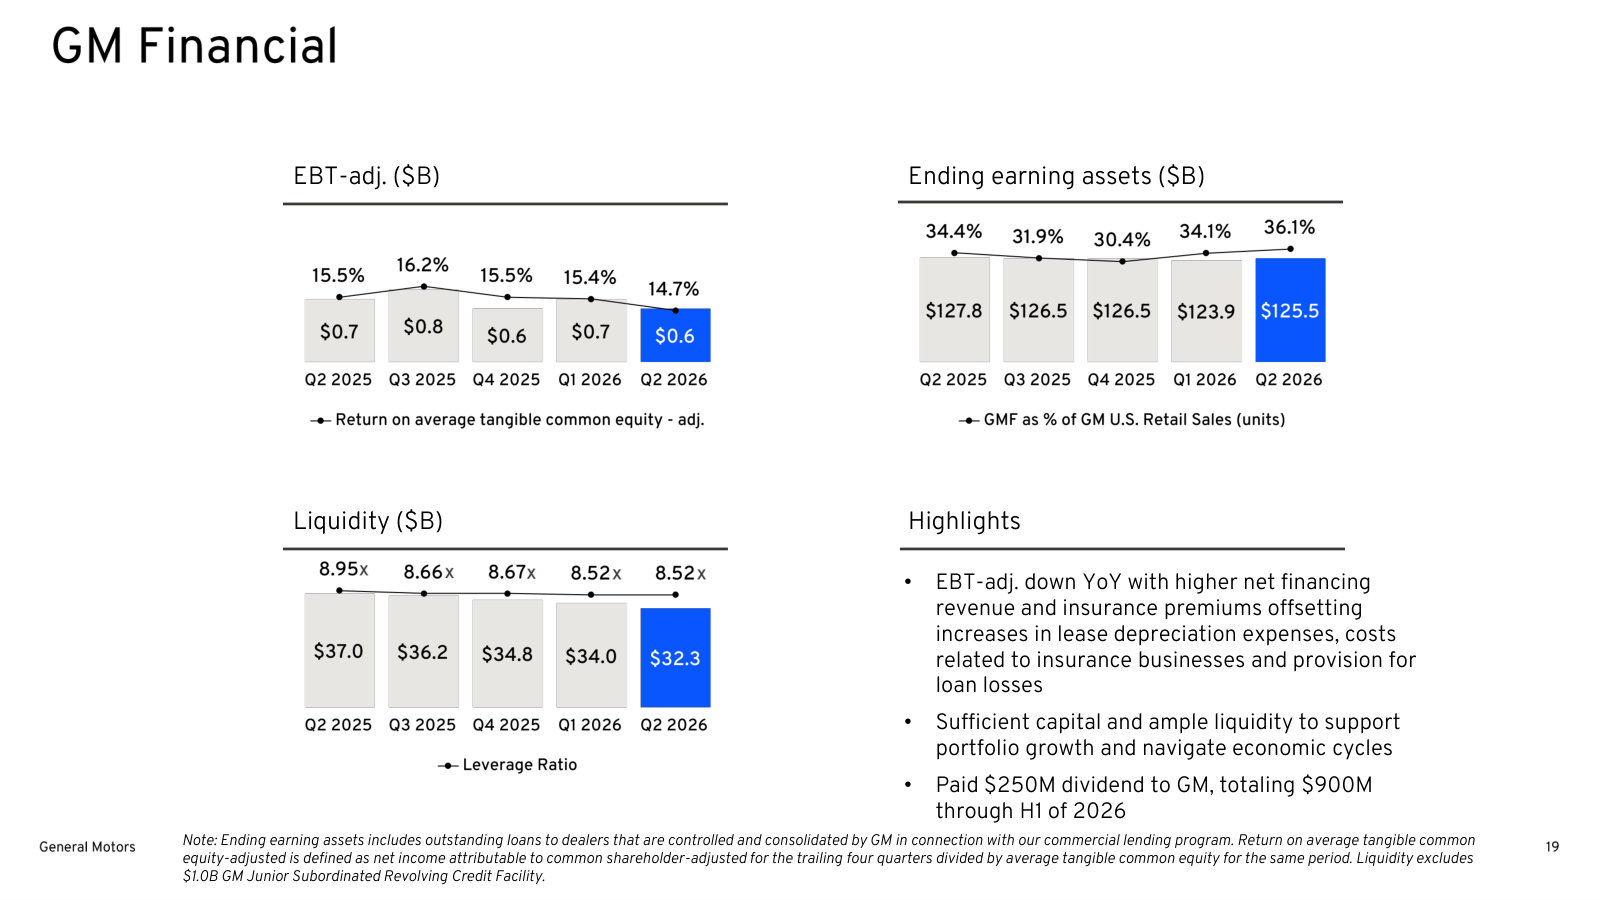
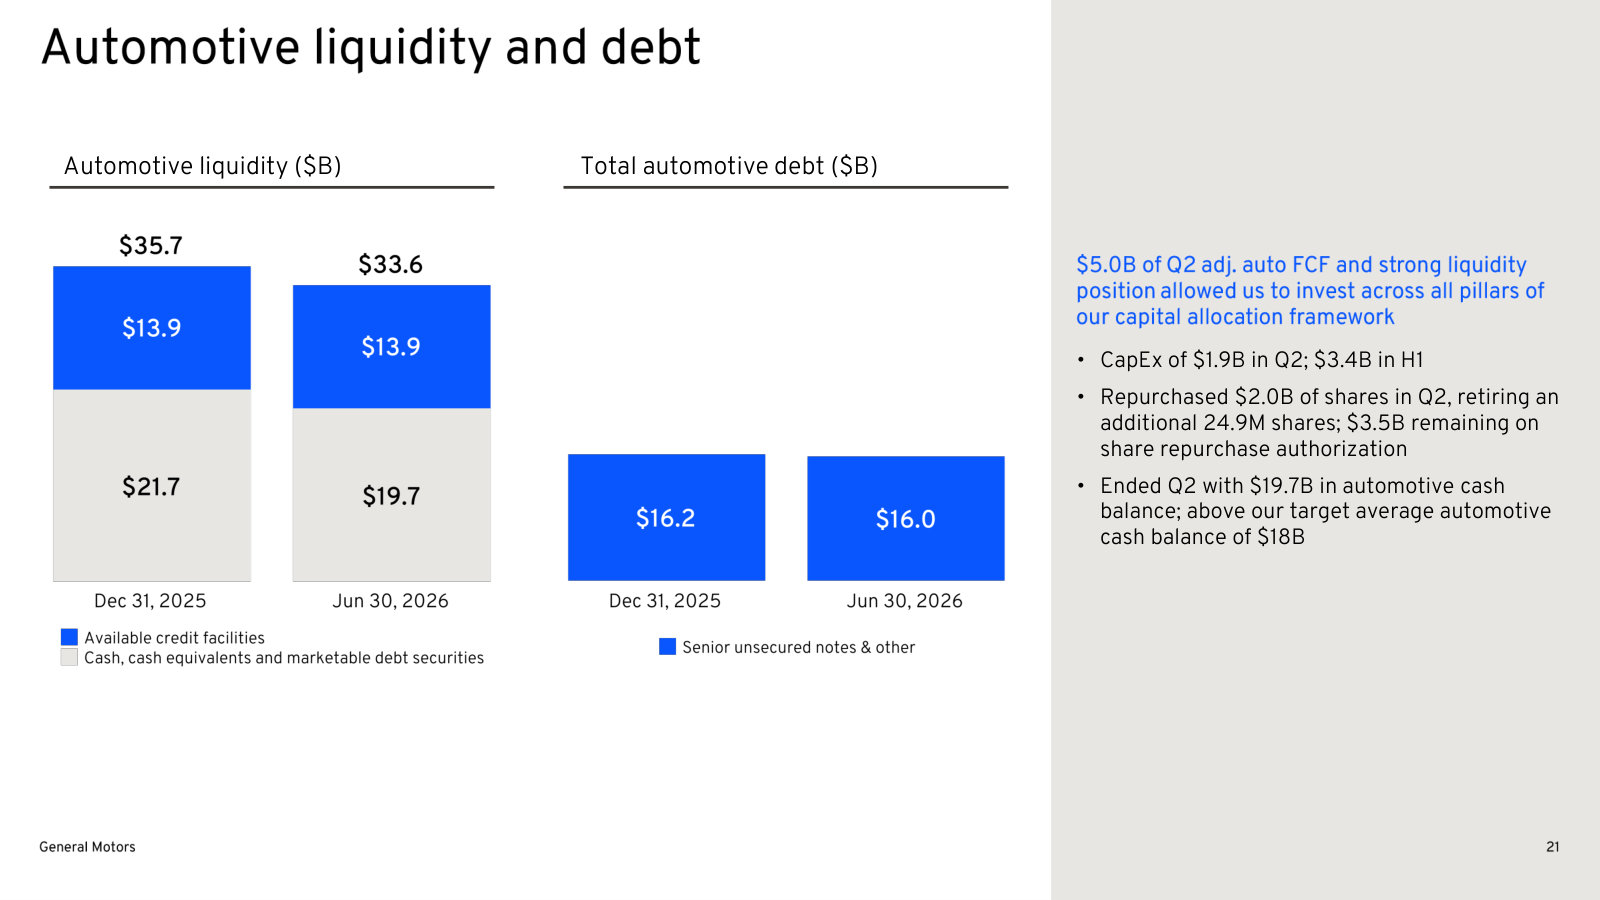
p. 4 — The quarter in six boxes - $3.9B EBIT-adj., 8.6% North America margin, plus the OnStar and buyback lines. · Open the full presentation →p. 5 — The franchise stated plainly: 43% of U.S. full-size pickups, 52 straight years leading full-size SUVs. · Open the full presentation →p. 6 — Incentive spend against the industry over three years - 4.7% of MSRP versus a 6.3% average. · Open the full presentation →p. 7 — OnStar's quarterly numbers: $6.3B deferred revenue, $800M recognized, and the Super Cruise attach rate. · Open the full presentation →p. 8 — The 2027 Silverado and Sierra - the product cycle behind next year's volume and 160K more Super Cruise trucks. · Open the full presentation →p. 9 — The cost of shrinking EVs: $10.9B of charges since H2 2025, $7.2B of it cash, and how much has been paid. · Open the full presentation →p. 10 — Full-year 2026 guidance with the assumptions spelled out - tariffs, warranty, commodities and EV losses. · Open the full presentation →p. 13 — The quarter against Q2 2025 on EPS, EBIT margin, cash flow and global share, with the reason for each move. · Open the full presentation →p. 14 — EBIT-adjusted split by segment - GMNA, GMI, GM Financial and corporate - which is where the profit actually sits. · Open the full presentation →p. 15 — The bridge from $3.0B to $3.9B: volume, mix, price, cost and other, with the explanation under each bar. · Open the full presentation →p. 16 — North America across five quarters of revenue, margin, dealer inventory and U.S. market share. · Open the full presentation →p. 17 — GM International excluding the China JV - the smaller, thinner-margin half of the international business. · Open the full presentation →p. 18 — The China joint venture, unconsolidated: revenue and wholesales that never enter GM's top line, plus equity income. · Open the full presentation →p. 19 — GM Financial's quarter - pre-tax profit, earning assets, leverage and the dividend paid up to the parent. · Open the full presentation →p. 21 — Automotive liquidity and debt at mid-year, the balance-sheet backdrop to the buyback. · Open the full presentation →
Q4 and Full-Year 2025 Earnings Presentation — FY2025 · 42 pages · Full-year 2025 results and the original 2026 guidance, including the $6.0B of Q4 EV-related charges. · Open →
Q4 and Full-Year 2024 Earnings Presentation — FY2024 · 48 pages · The 2024 peak - $14.9B EBIT-adj. before tariffs - and the 2025 guidance management set against it. · Open →
Investor Day 2024 - Mary Barra Keynote — 2024 · 21 pages · The CEO's investor day slides. Headline numbers over photographs, so the substance sits in the spoken remarks. · Open →
Q4 and Full-Year 2023 Earnings Presentation — FY2023 · 45 pages · How GM framed the EV ramp and its 2024 targets before both were cut back - useful for what changed. · Open →
Q3 2023 Earnings Presentation — Q3 2023 · 40 pages · The last deck presenting Cruise as a growth business, alongside the Ultium battery plans of that period. · Open →