Full Report
The numbers behind General Motors Company: as-reported financial statements and company metrics for FY2021–FY2025, traced to the source filings, opened with the share-price history those statements have to justify. Every linked figure opens the exact page of the filing it was printed on, with the statement row highlighted. Amounts in US$ millions unless noted.
Reading notes: Display unit is US$ millions; per-share values and share counts are as printed. Cash-flow outflows (capex, buybacks, dividends) are shown as printed negatives. Each fiscal year FY2021–FY2025 is cited to that year's own Form 10-K (leftmost/most-recent column of the audited statement). Revenue by segment uses Note 23 'Net sales and revenue' by reportable segment (GM North America, GM International, Cruise, GM Financial). These four segments do not foot exactly to Total net sales and revenue because Corporate net sales and intersegment eliminations (a small reconciling residual, ~0.1% of revenue) are excluded; the GM Financial segment figure (e.g. FY2025 $17,060M) is gross of the $12M eliminated on consolidation ($17,048M). Cruise revenue collapsed to $1M in FY2025 as GM wound down its Cruise robotaxi operations; the FY2025 GM North America EBIT-adjusted and revenue therefore are not directly comparable to prior years on a Cruise basis.
Share Price — Full Available History — 16 Years
The stock closed at $90.30 on Jul 28, 2026 — up 164% over the window shown (+6.4% a year), trading between $16.80 and $90.30. At that close the stock trades at 28× FY2025 diluted EPS as reported below.
Source: market price feed, monthly closes, sampled from 3,945 source observations, Nov 2010–Jul 2026. Price return only, excludes dividends.
Market capitalization $141.8bn.
Market cap = 1.57B shares outstanding × the Jul 28, 2026 close of $90.30. Market-derived, shown without filing links.
FY2025 at a Glance
Revenue (US$ millions)
Operating income (US$ millions)
Net income (US$ millions)
Diluted EPS
Source: FY2025 consolidated statements [1] [2] [3] [4]. Click any linked figure to open the filing page with the row highlighted.
Revenue by Segment
| Revenue by Segment | FY2021 | FY2022 | FY2023 | FY2024 | FY2025 |
|---|---|---|---|---|---|
| GM North America | 101,308 | 128,378 | 141,445 | 157,509 | 154,317 |
| GM International | 12,172 | 15,420 | 15,949 | 13,890 | 13,427 |
| Cruise | 106 | 102 | 102 | 257 | 1 |
| GM Financial | 13,419 | 12,766 | 14,225 | 15,875 | 17,060 |
| Total net sales and revenue | 127,004 | 156,735 | 171,842 | 187,442 | 185,019 |
| Total net sales and revenue growth, derived | — | +23.4% | +9.6% | +9.1% | -1.3% |
Source: Note 23 Segment Reporting (net sales and revenue by reportable segment); consolidated total from the Consolidated Income Statements [5] [1] [6] [2]. Click any linked figure to open the filing page with the row highlighted.
EBIT-Adjusted by Segment
| EBIT-Adjusted by Segment | FY2021 | FY2022 | FY2023 | FY2024 | FY2025 |
|---|---|---|---|---|---|
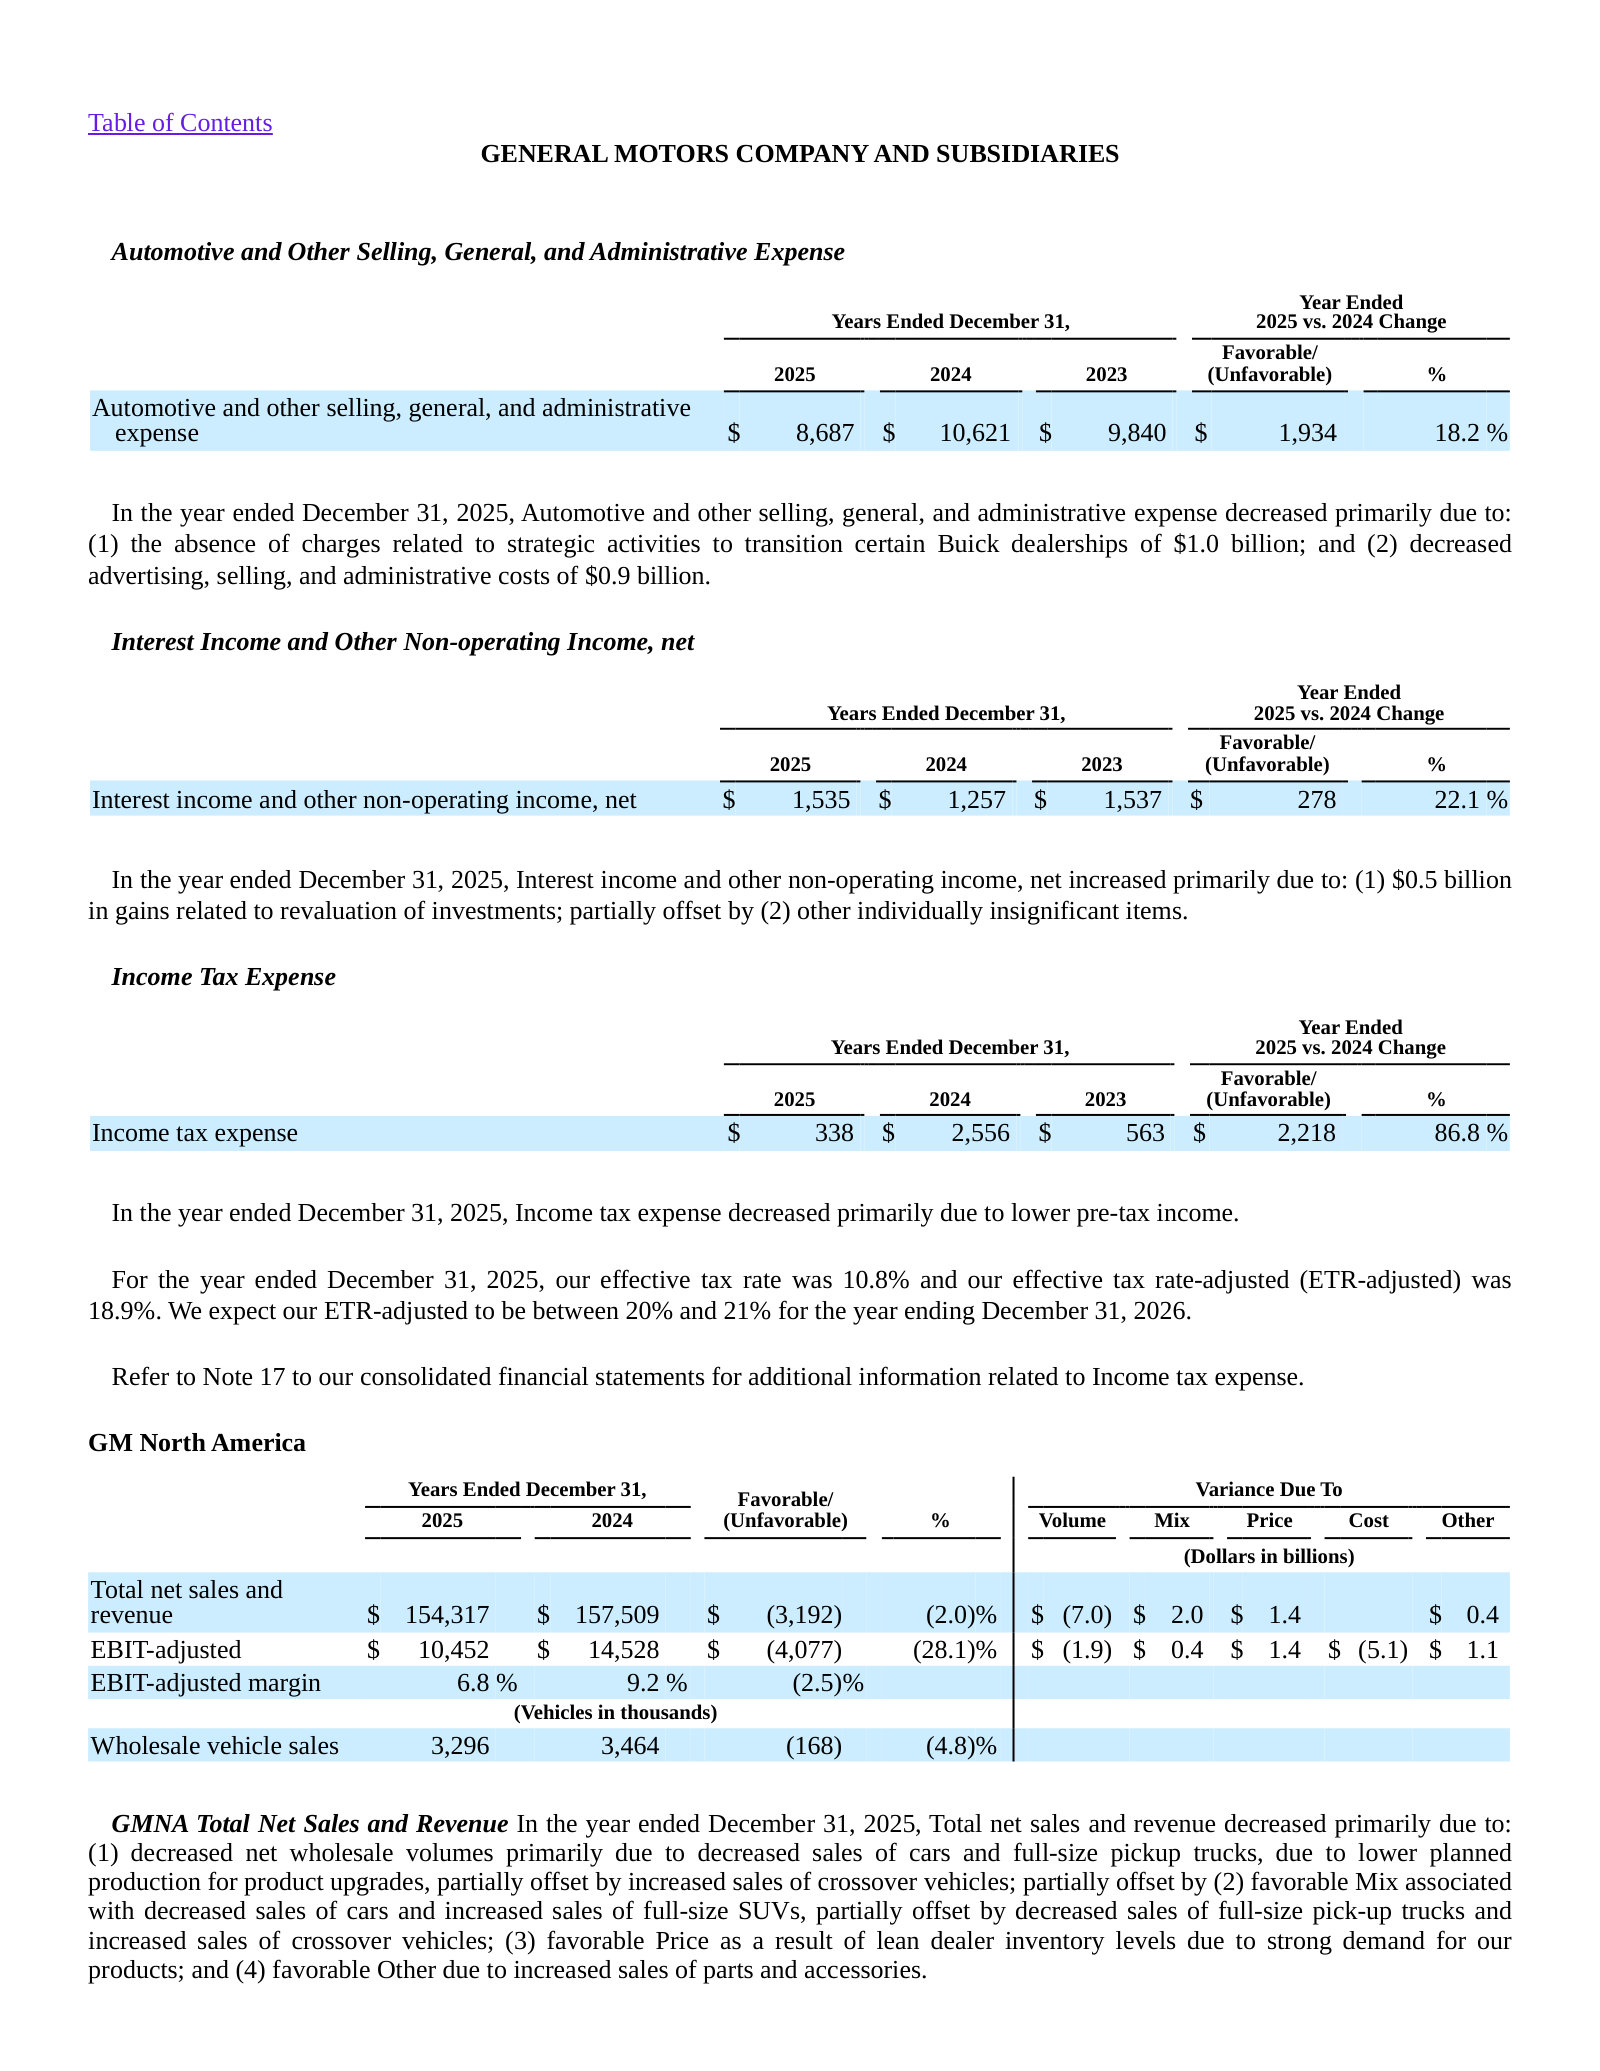
| GM North America | 10,318 | 12,988 | 12,306 | 14,528 | 10,452 |
| GM International | 827 | 1,143 | 1,210 | 303 | 737 |
| Cruise | (1,196) | (1,890) | (2,695) | (1,701) | (273) |
| GM Financial | 5,036 | 4,076 | 2,985 | 2,965 | 2,802 |
Source: Note 23 Segment Reporting — Earnings (loss) before interest and taxes-adjusted (GM Financial shown on an EBT-adjusted basis) [5] [6] [7] [8]. Click any linked figure to open the filing page with the row highlighted.
Income Statement
Source: Consolidated Income Statements [1] [2] [3] [4]. Click any linked figure to open the filing page with the row highlighted.
Columns marked E are consensus analyst estimates from S&P Capital IQ (CapIQ), shown alongside reported results for direct comparison; they are not company guidance.
Estimate source: S&P Capital IQ (CapIQ) consensus, as of 2026-07-29. Estimate figures are S&P Capital IQ consensus (vendor data — no filing page links). EPS and net income use the normalized (adjusted) consensus where the street reports it. Line-item analyst models (segments, drivers, KPIs) are in the Visible Alpha tab.
Balance Sheet
Source: Consolidated Balance Sheets [9] [10] [11] [12]. Click any linked figure to open the filing page with the row highlighted.
Cash Flow
Source: Consolidated Statements of Cash Flows [13] [14] [15] [16]. Click any linked figure to open the filing page with the row highlighted.
Vehicle Sales Market Share
| Vehicle Sales Market Share | FY2021 | FY2022 | FY2023 | FY2024 | FY2025 |
|---|---|---|---|---|---|
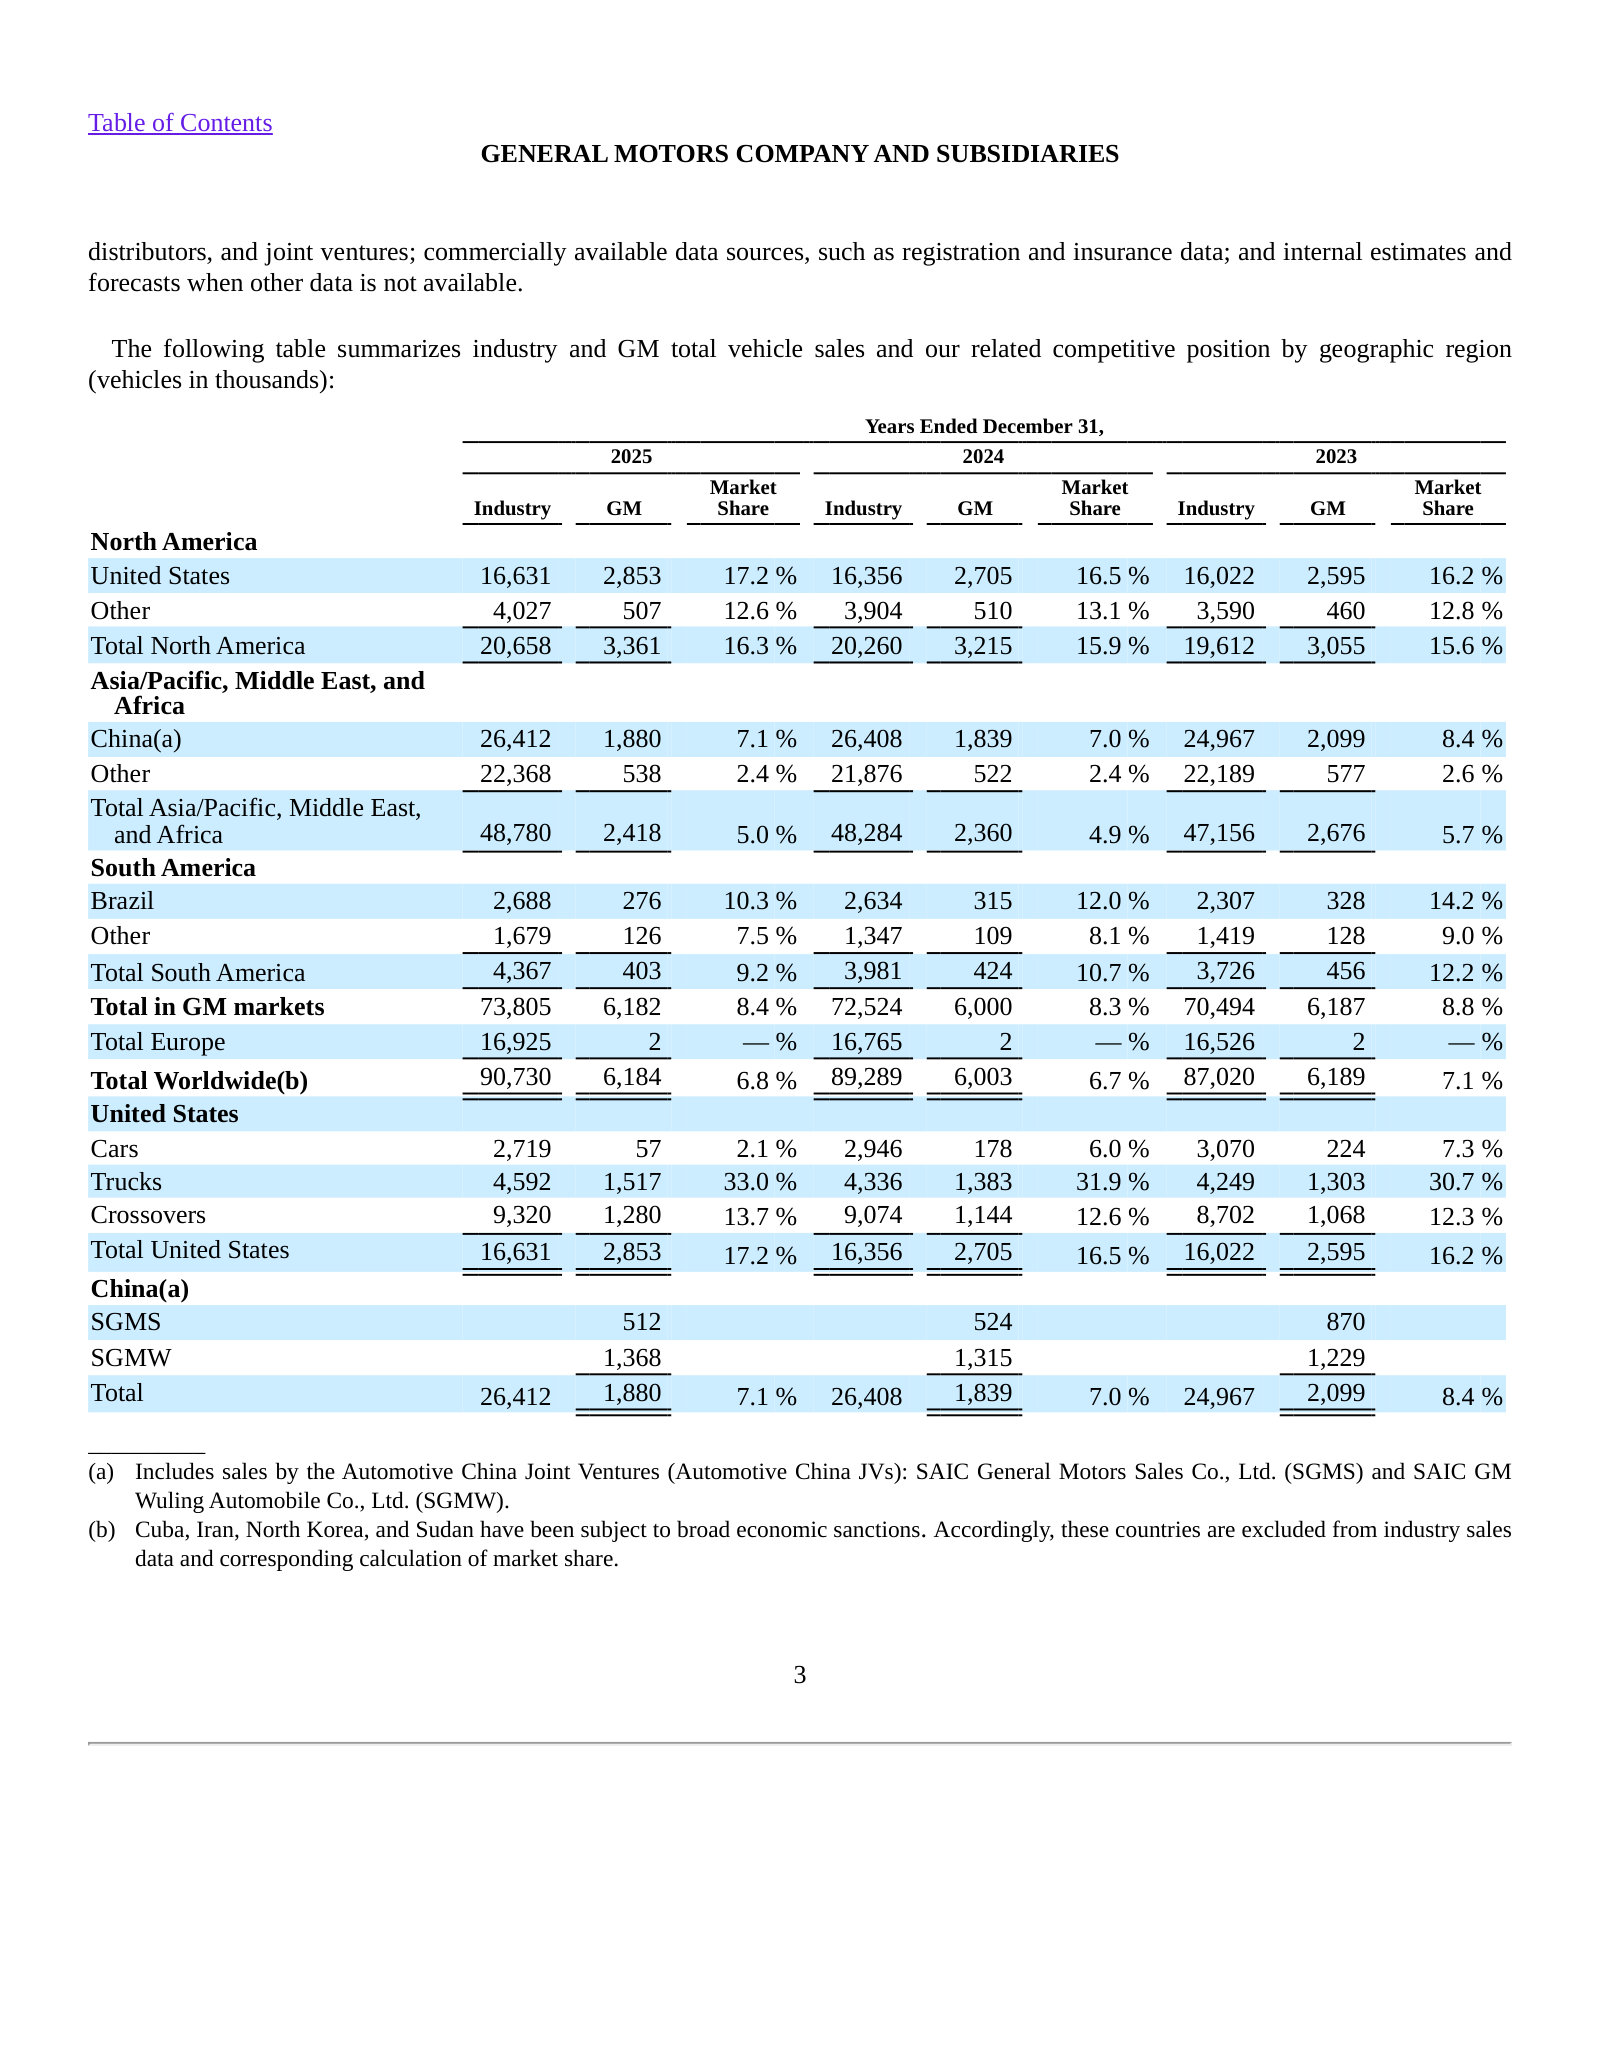
| U.S. total vehicle sales (000s) | 2,218 | 2,274 | 2,595 | 2,705 | 2,853 |
| U.S. market share | 14.4% | 16.0% | 16.2% | 16.5% | 17.2% |
| Total worldwide vehicle sales (000s) | 6,296 | 5,941 | 6,189 | 6,003 | 6,184 |
| China vehicle sales (000s) | 2,892 | 2,303 | 2,099 | 1,839 | 1,880 |
| Wholesale vehicle sales (000s) | 2,859 | 3,579 | 3,768 | 4,010 | 3,799 |
| Fleet sales as % of total vehicle sales | 11.3% | 16.7% | 19.2% | 16.9% | 17.7% |
Source: company filings [17] [18] [19] [20]. Click any linked figure to open the filing page with the row highlighted.
Returns Profitability (non-GAAP as reported)
| Returns Profitability (non-GAAP as reported) | FY2021 | FY2022 | FY2023 | FY2024 | FY2025 |
|---|---|---|---|---|---|
| EPS-diluted-adjusted | 7.07 | 7.59 | 7.68 | 10.60 | 10.60 |
| ROIC-adjusted | 21.3% | 20.0% | 16.4% | 20.8% | 19.3% |
| Return on equity (ROE) | 17.7% | 14.9% | 14.1% | 8.7% | 4.2% |
| GMNA EBIT-adjusted margin | 10.2% | 10.1% | 8.7% | 9.2% | 6.8% |
Source: company filings [21] [22] [23] [24]. Click any linked figure to open the filing page with the row highlighted.
GM Financial — Credit Portfolio
| GM Financial — Credit Portfolio | FY2021 | FY2022 | FY2023 | FY2024 | FY2025 |
|---|---|---|---|---|---|
| Provision for loan losses | 248 | 654 | 826 | 1,029 | 1,207 |
| Allowance for loan losses (period-end) | 1,886 | 2,096 | 2,344 | 2,458 | 2,725 |
| Allowance as % of finance receivables | — | 2.7% | 2.7% | 2.6% | 2.9% |
| U.S. retail financing penetration | 44.0% | 43.0% | 42.0% | 39.0% | 33.0% |
| Retail receivables 30+ days delinquent or in repossession | — | 2.9% | 3.1% | 3.5% | 3.8% |
Source: company filings [25] [26] [27] [28]. Click any linked figure to open the filing page with the row highlighted.
Long-Term Record
| Fiscal year | Total net sales and revenue | Operating income (loss) | Net income (loss) attributable to stockholders | Diluted earnings per common share | Net cash provided by operating activities | Capital expenditures |
|---|---|---|---|---|---|---|
| FY2016 | — | 8,686 | 9,427 | 6.00 | 16,607 | 8,384 |
| FY2017 | — | 8,661 | (3,864) | (2.60) | 17,328 | 8,453 |
| FY2018 | — | 4,445 | 8,014 | 5.53 | 15,256 | 8,761 |
| FY2019 | 137,237 | 5,481 | 6,732 | 4.57 | 15,021 | 7,592 |
| FY2020 | 122,485 | 6,634 | 6,427 | 4.33 | 16,670 | 5,300 |
| FY2021 | 127,004 | 9,324 | 10,019 | 6.70 | 15,188 | 7,509 |
| FY2022 | 156,735 | 10,315 | 9,934 | 6.13 | 16,043 | 9,238 |
| FY2023 | 171,842 | 9,298 | 10,127 | 7.32 | 20,930 | 10,970 |
| FY2024 | 187,442 | 12,784 | 6,008 | 6.37 | 20,129 | 10,830 |
| FY2025 | 185,019 | 2,909 | 2,697 | 3.27 | 26,867 | 9,303 |
Source: consolidated statements across filings; older years from the standardized feed [13] [1] [14] [2]. Click any linked figure to open the filing page with the row highlighted.
Analyst Consensus
Mean target
Median target
High target
Low target
Street ratings: 15 strong buy, 7 buy, 4 hold, 1 sell, 1 strong sell. Consensus: Buy.
Estimate source: S&P Capital IQ (CapIQ) consensus, as of 2026-07-29. Estimate figures are S&P Capital IQ consensus (vendor data — no filing page links). EPS and net income use the normalized (adjusted) consensus where the street reports it. Line-item analyst models (segments, drivers, KPIs) are in the Visible Alpha tab.
Traceability
419 of 435 figures on this page (96%) link to the filing page where they are printed — click a linked figure to open the source PDF at that page with the row highlighted. Unlinked figures come from standardized data feeds or pre-filing years.
Display unit is US$ millions; per-share values and share counts are as printed. Cash-flow outflows (capex, buybacks, dividends) are shown as printed negatives.
Each fiscal year FY2021–FY2025 is cited to that year's own Form 10-K (leftmost/most-recent column of the audited statement).
Revenue by segment uses Note 23 'Net sales and revenue' by reportable segment (GM North America, GM International, Cruise, GM Financial). These four segments do not foot exactly to Total net sales and revenue because Corporate net sales and intersegment eliminations (a small reconciling residual, ~0.1% of revenue) are excluded; the GM Financial segment figure (e.g. FY2025 $17,060M) is gross of the $12M eliminated on consolidation ($17,048M).
Cruise revenue collapsed to $1M in FY2025 as GM wound down its Cruise robotaxi operations; the FY2025 GM North America EBIT-adjusted and revenue therefore are not directly comparable to prior years on a Cruise basis.
Long-term record: FY2019–FY2025 are filing-verified; FY2016–FY2018 are from the standardized SEC XBRL feed and shown without page links. Total net sales and revenue is not available in the feed for FY2016–FY2018 (the feed carries the Automotive line only), so those cells are left blank.
Quarterly window FY2025 Q1 through FY2026 Q2. Single-quarter income for Q1–Q3 FY25 and Q1–Q2 FY26 is printed directly in each 10-Q; Q4 FY25 is derived (FY2025 10-K full year minus the Q3 FY25 nine-month year-to-date) and marked accordingly. Q4 FY25 operating income was negative (−$3,646M) reflecting fourth-quarter 2025 charges. Q4 FY25 diluted EPS is left blank (EPS is not additively derivable).
Quarterly cash-flow single quarters are derived from printed year-to-date statements and cross-checked to data/financials/cash_flow_quarterly.json (operating cash flow and capex reconcile exactly).
2 figure(s) differed between the data feed and the filing; the filing value is shown (see the run's metrics/metrics_tab.json for the audit trail).
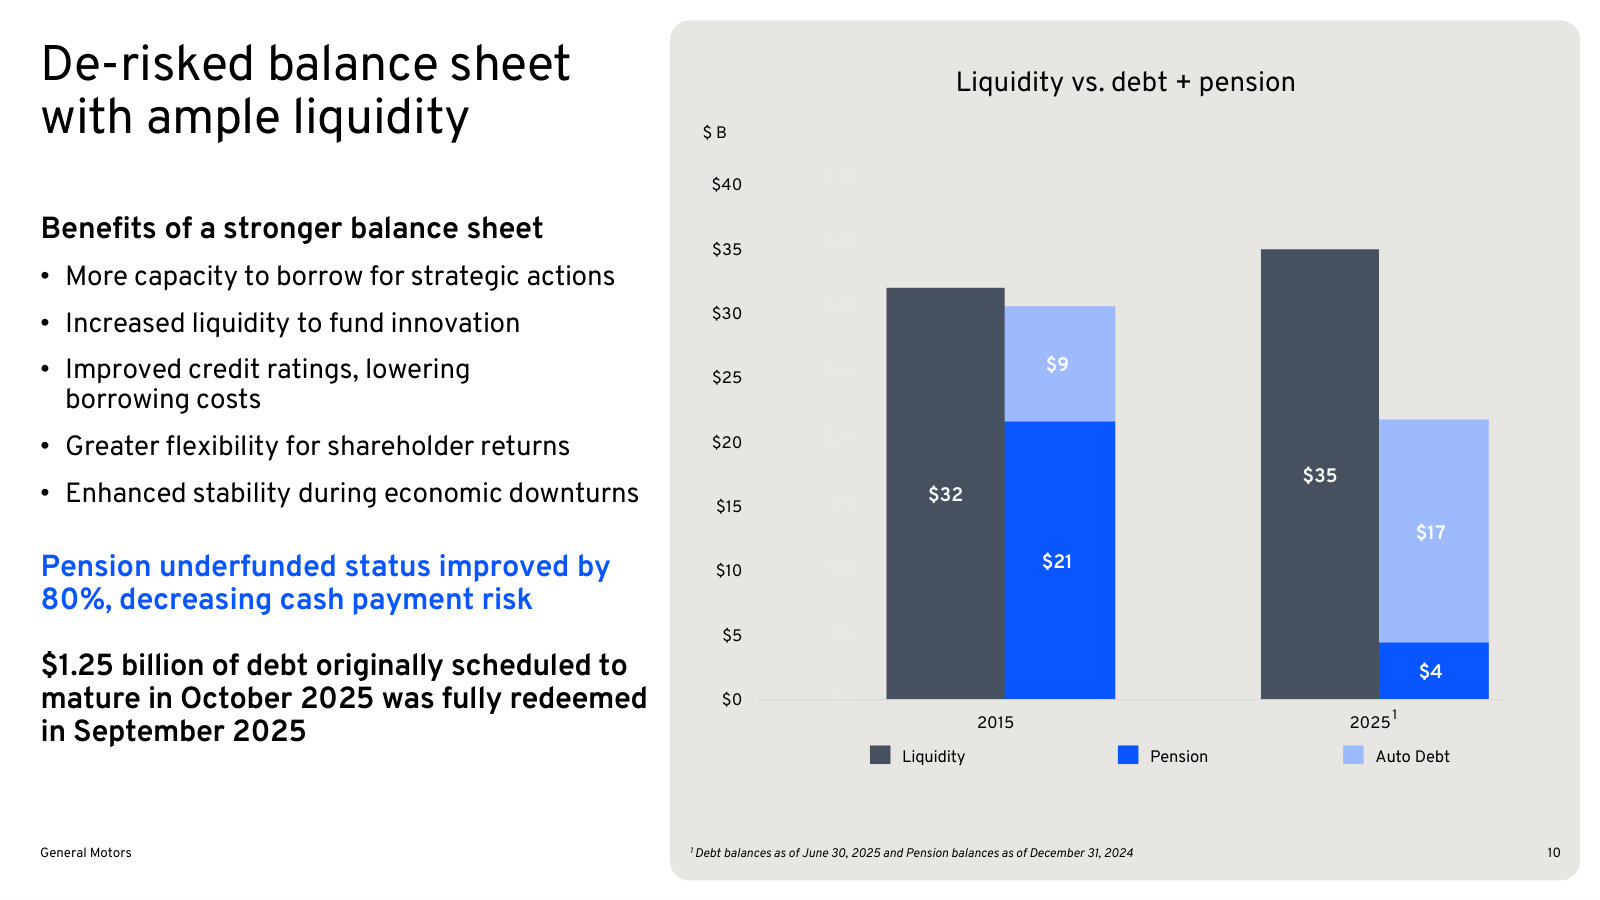
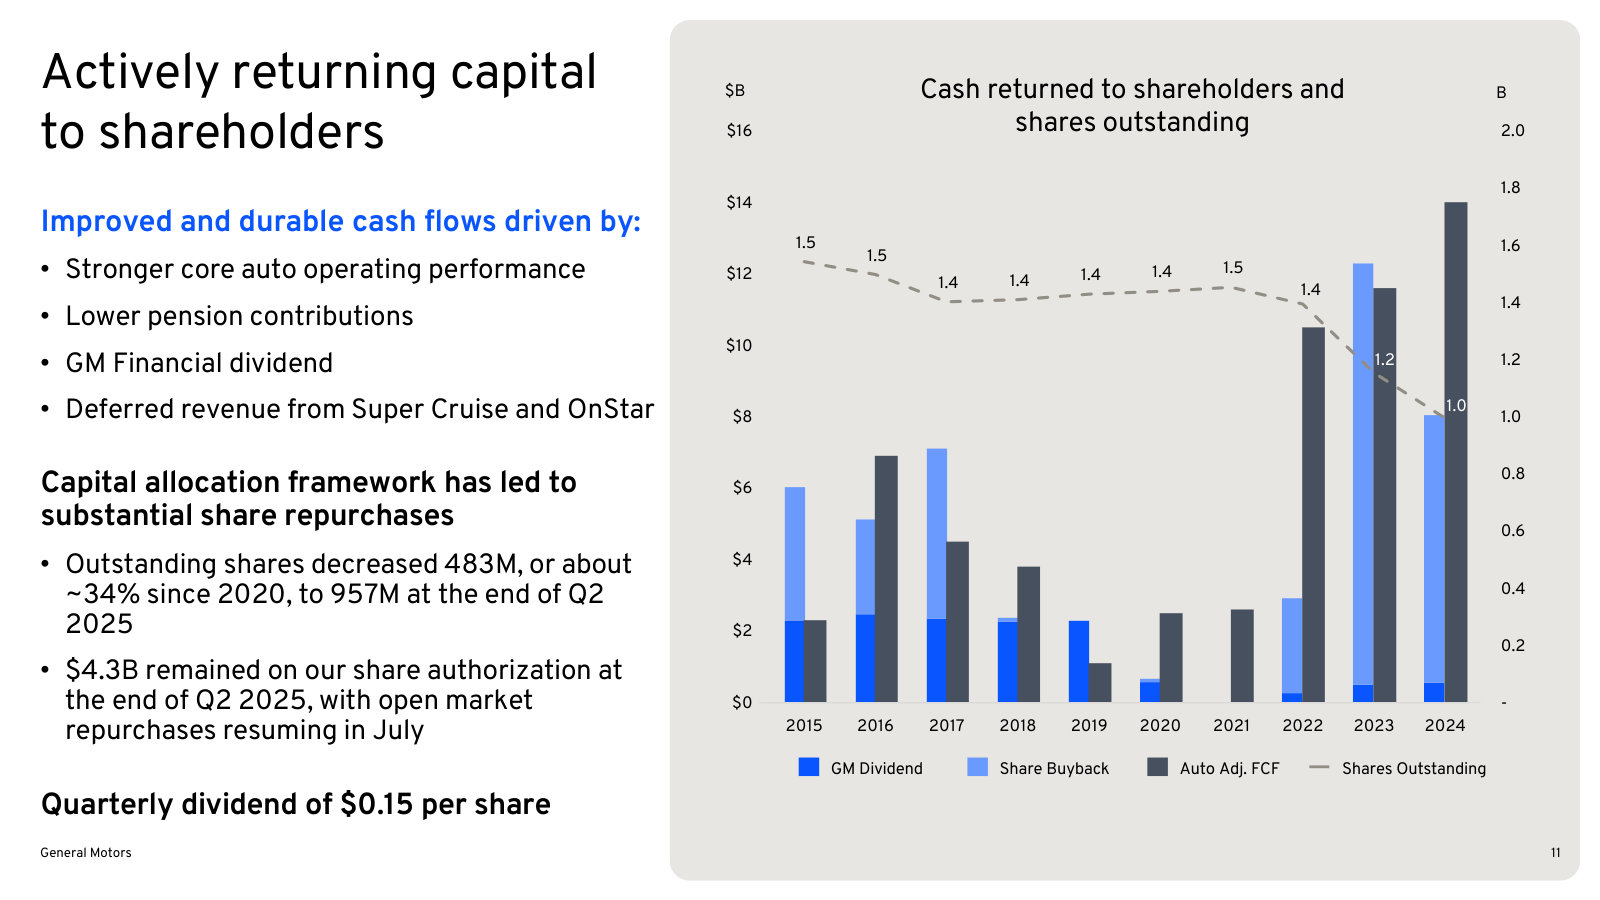
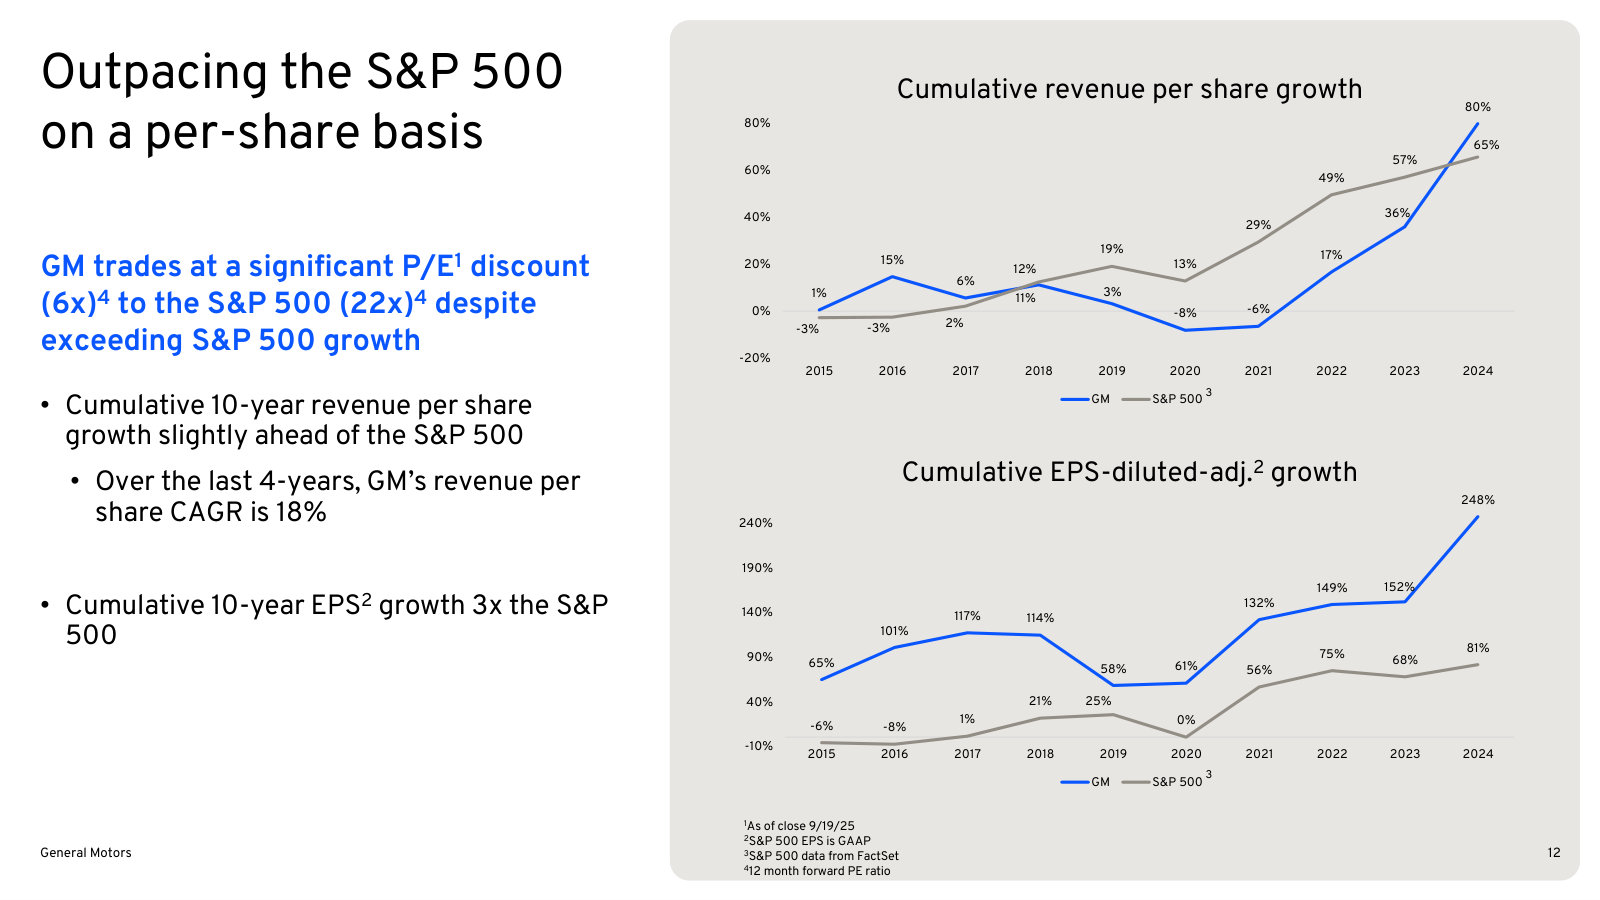
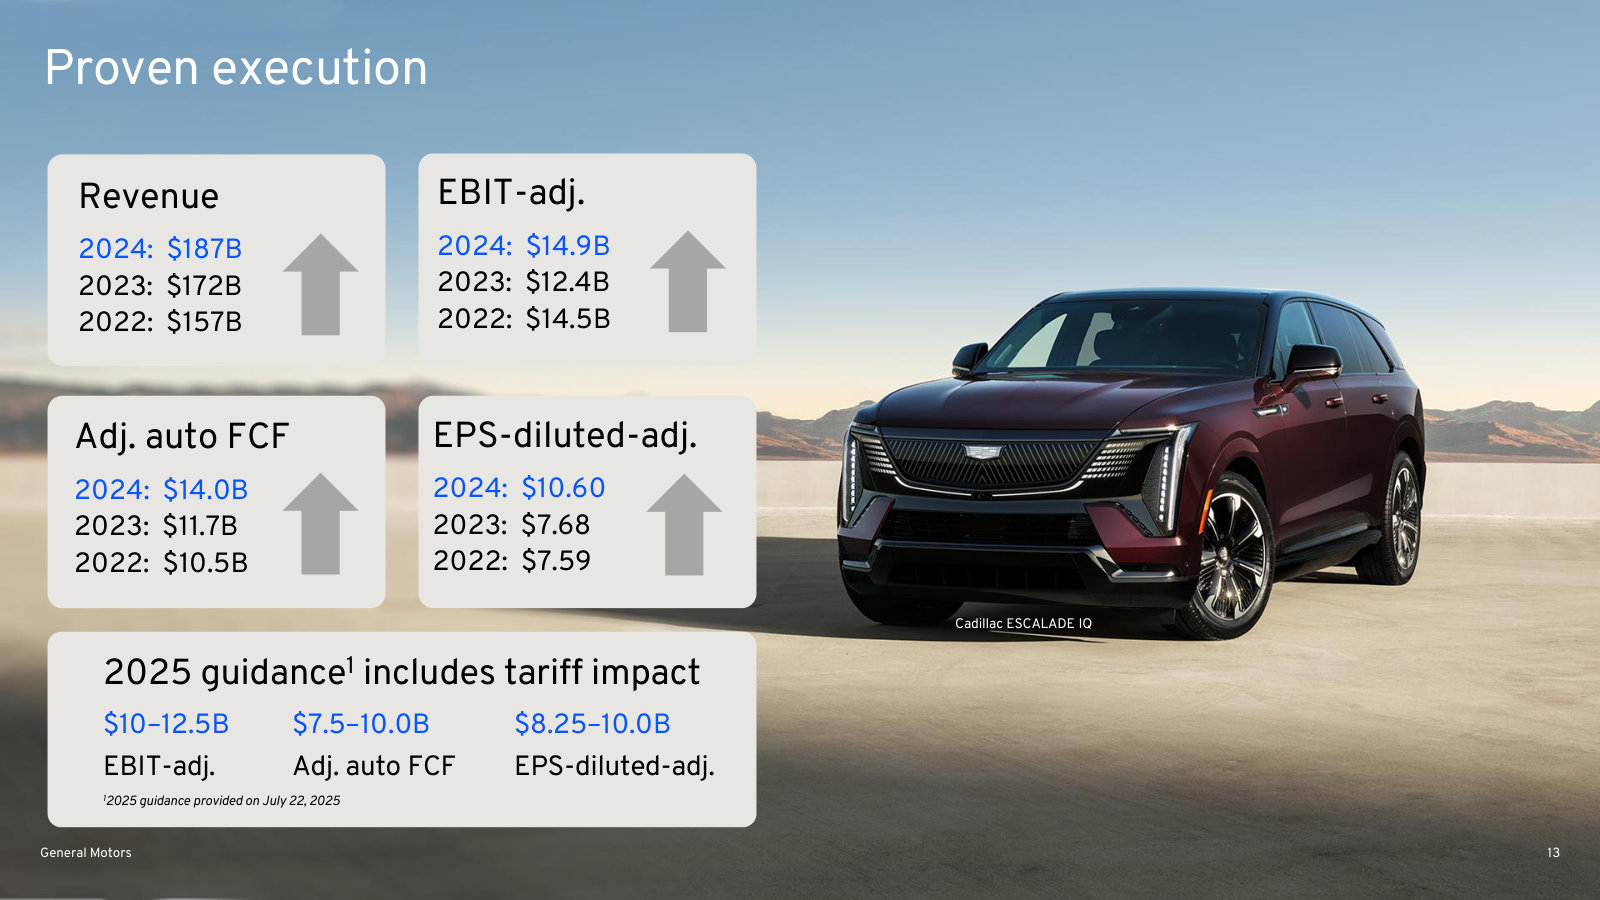
General Motors Company's management explains the business in its own materials. The slides below do the most of that work, pulled from the documents preserved in Sources. Each source link opens the complete presentation at that slide in a new tab.
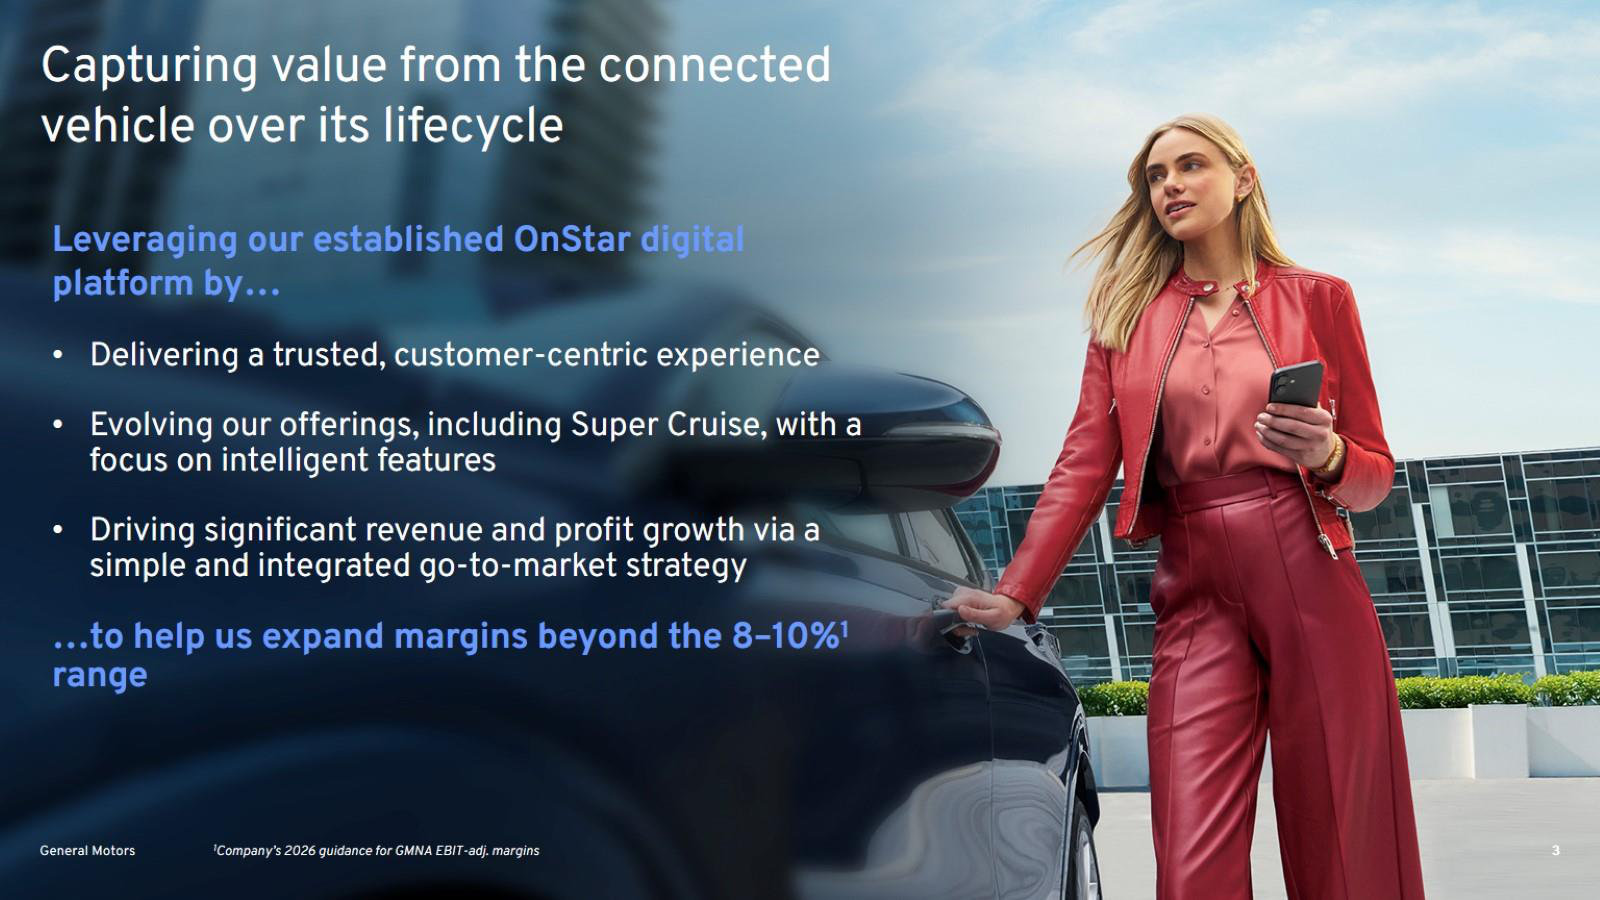
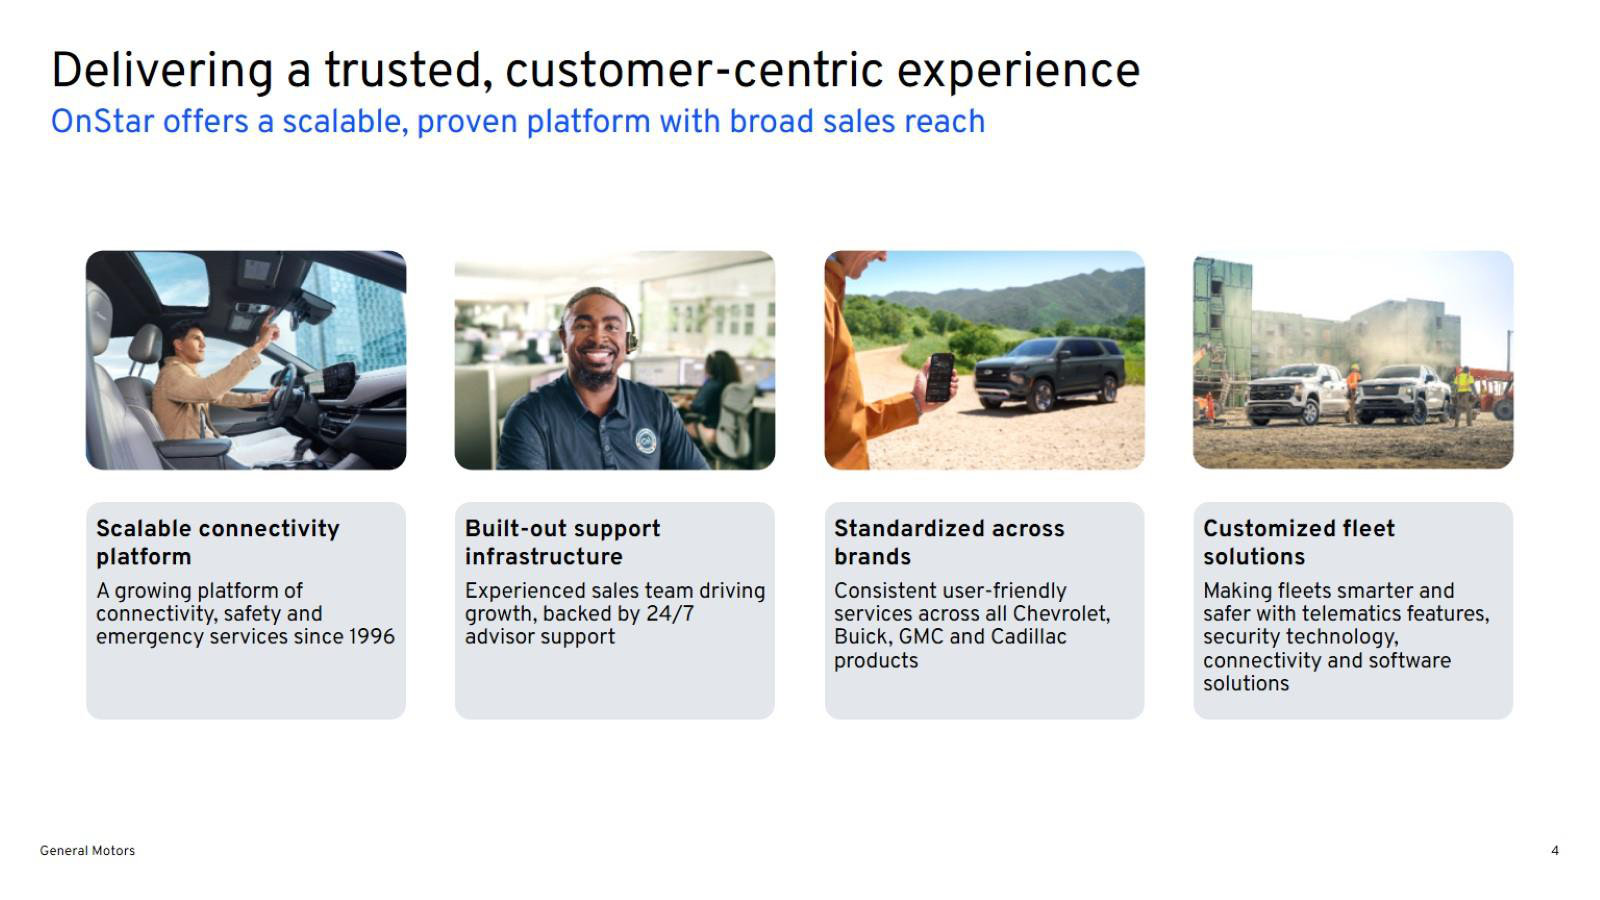
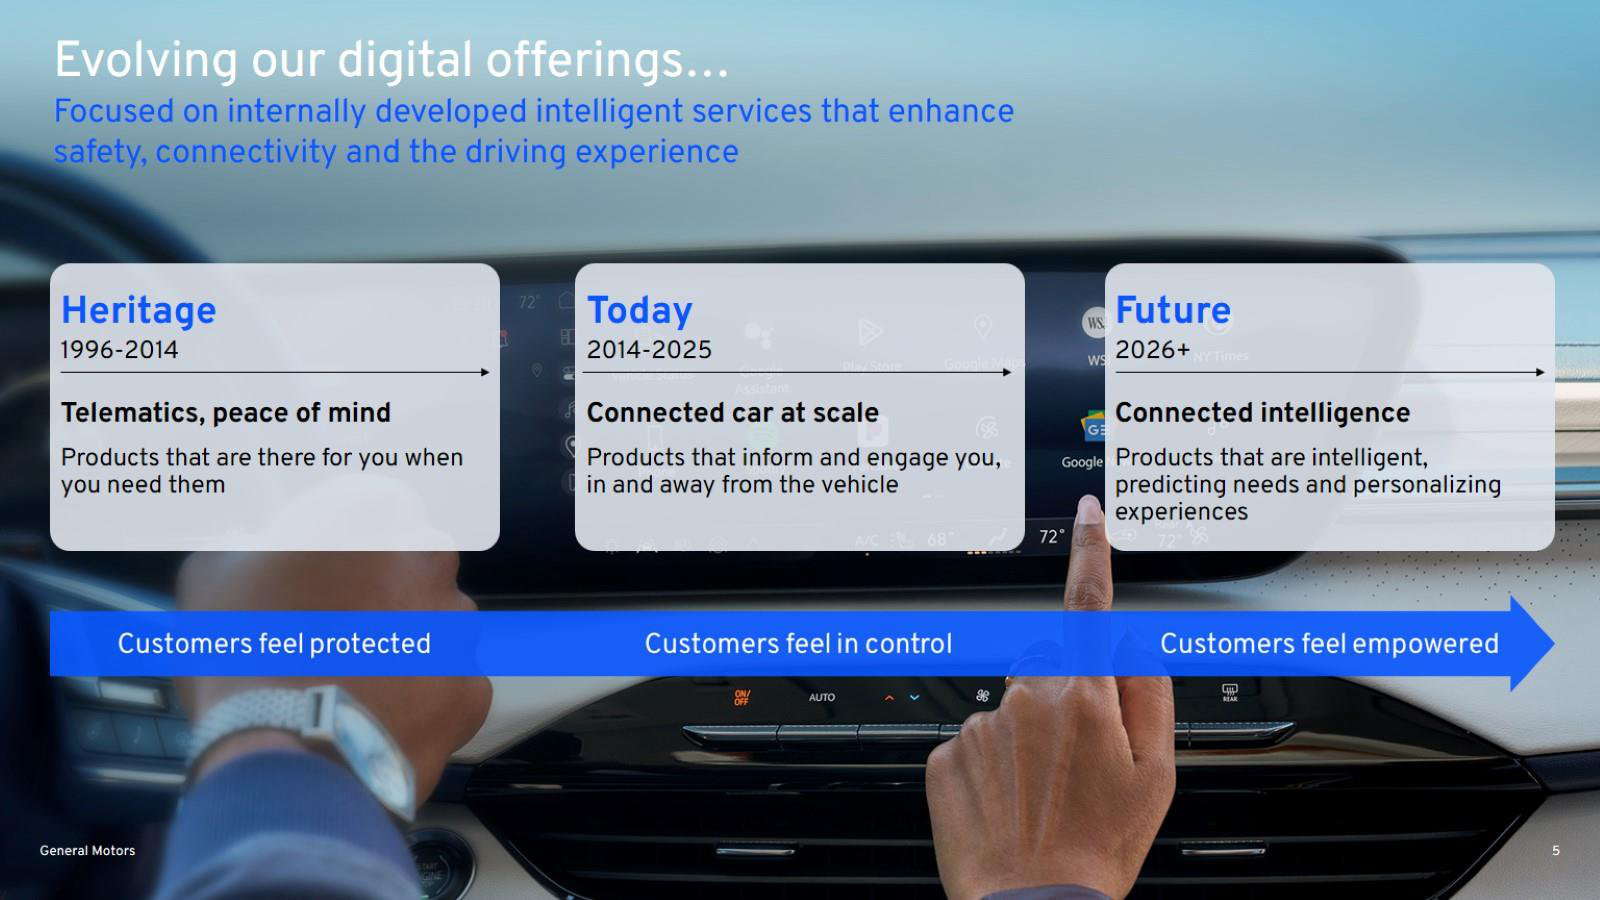
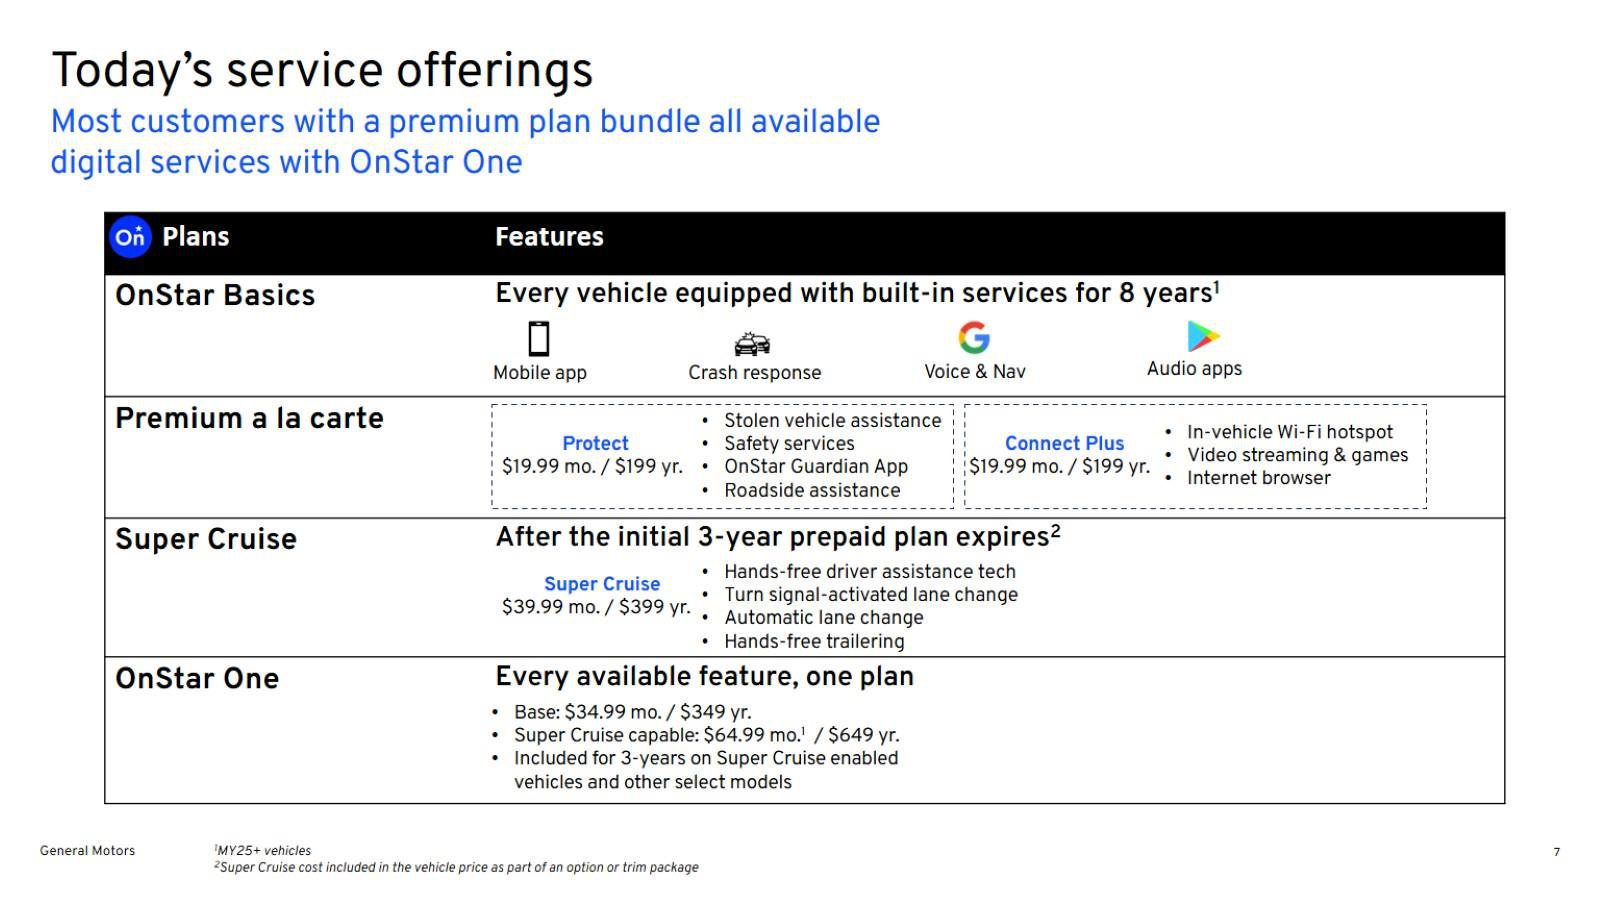
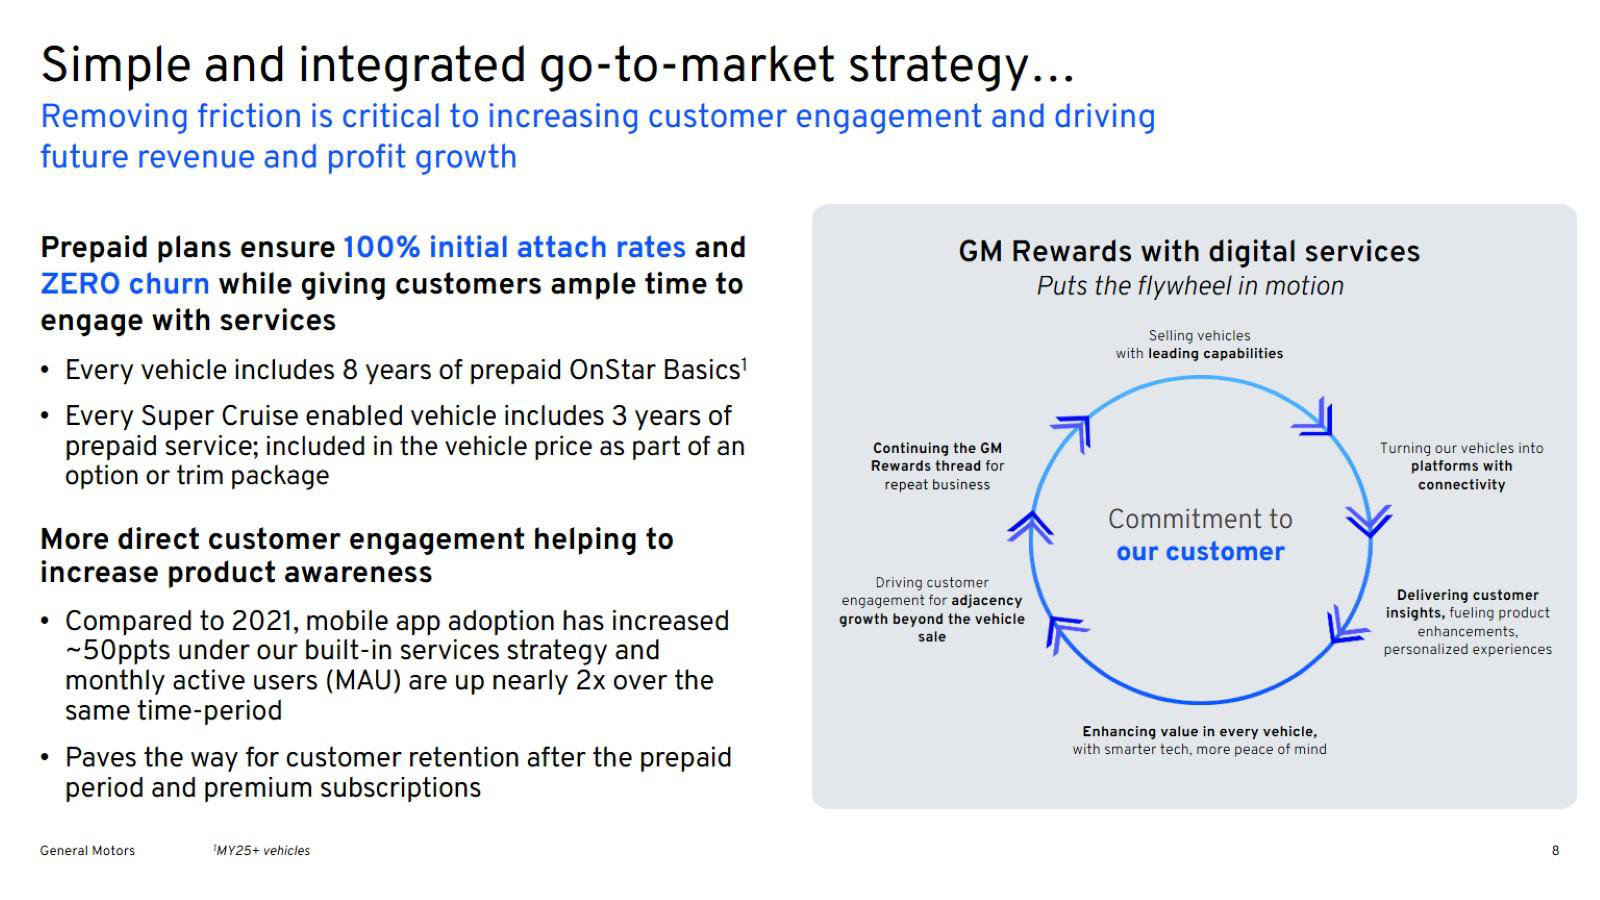
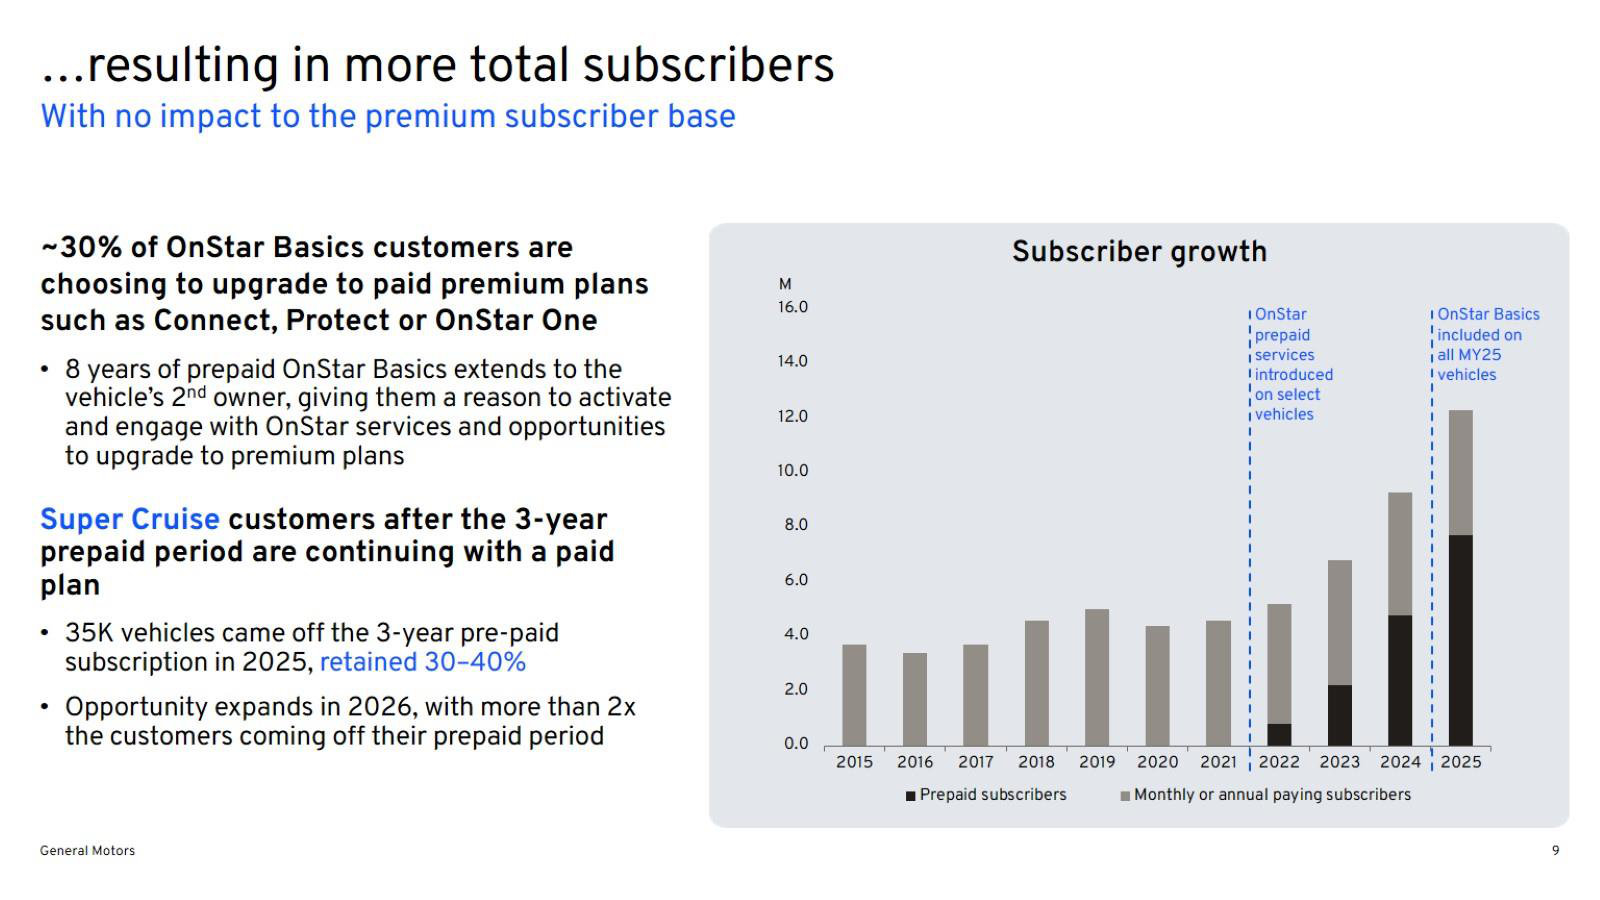
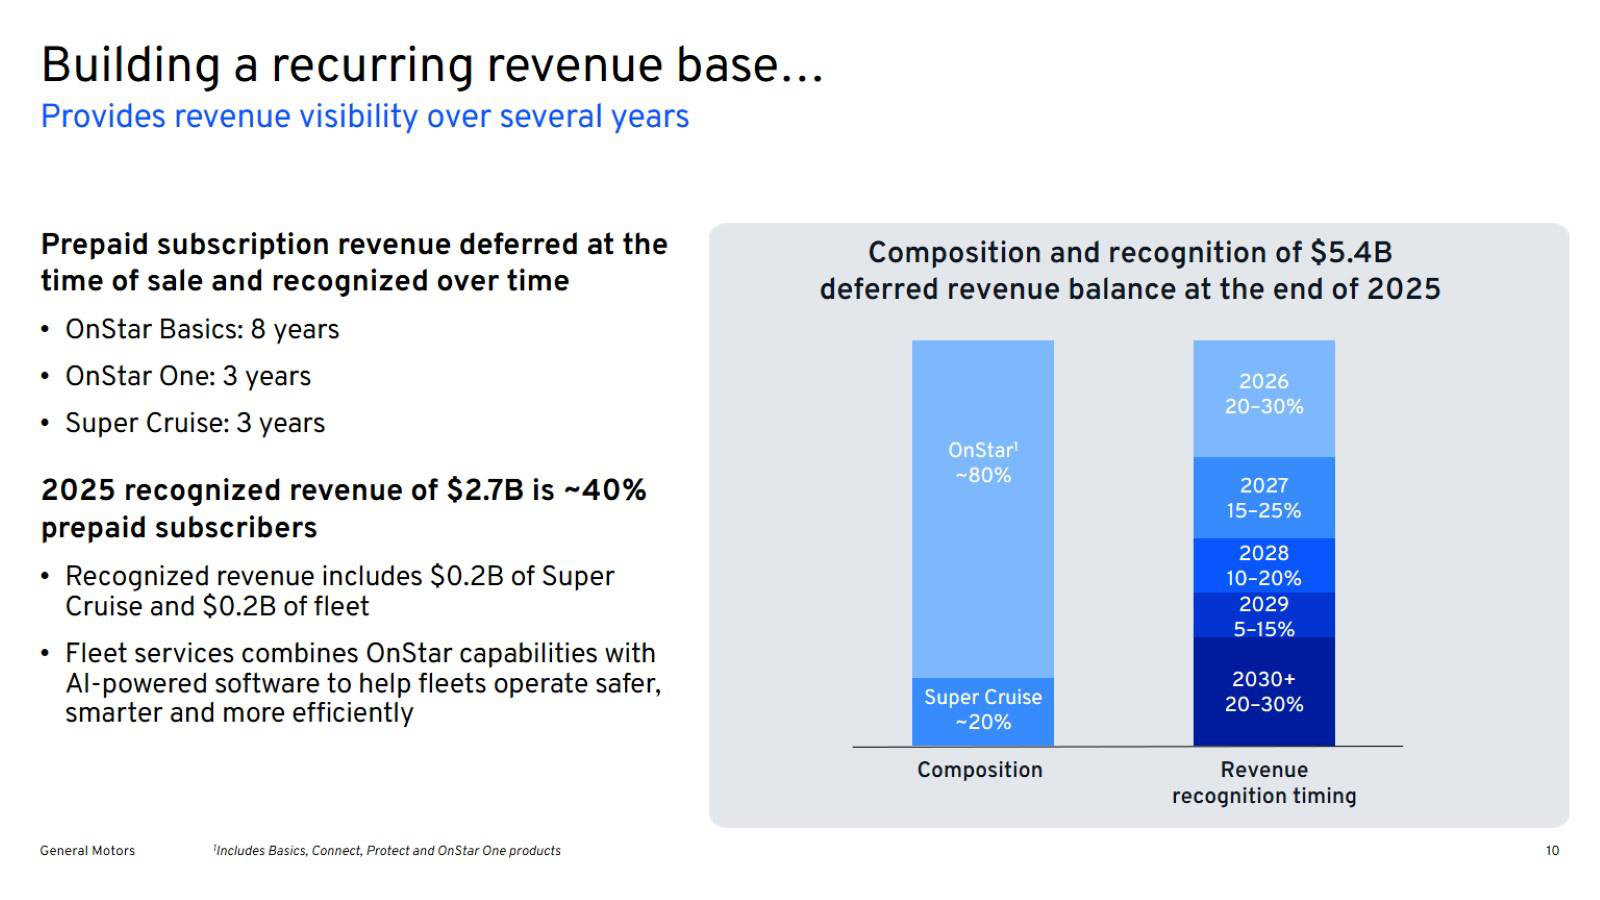
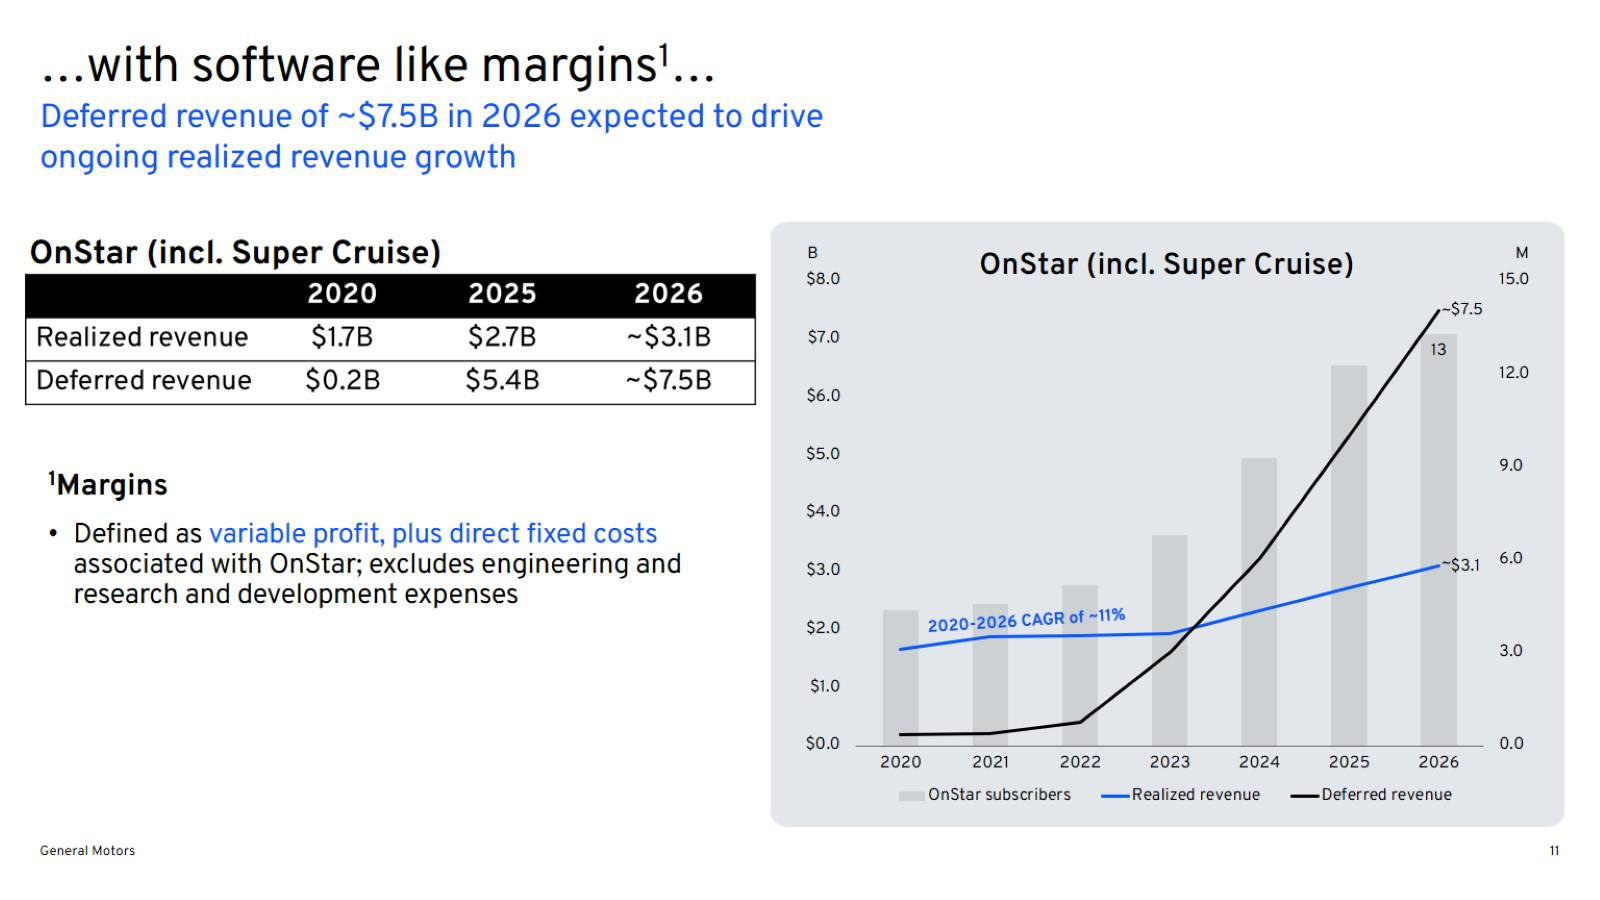
Growing a Digital Services Profit Engine (OnStar / Super Cruise) — 2026
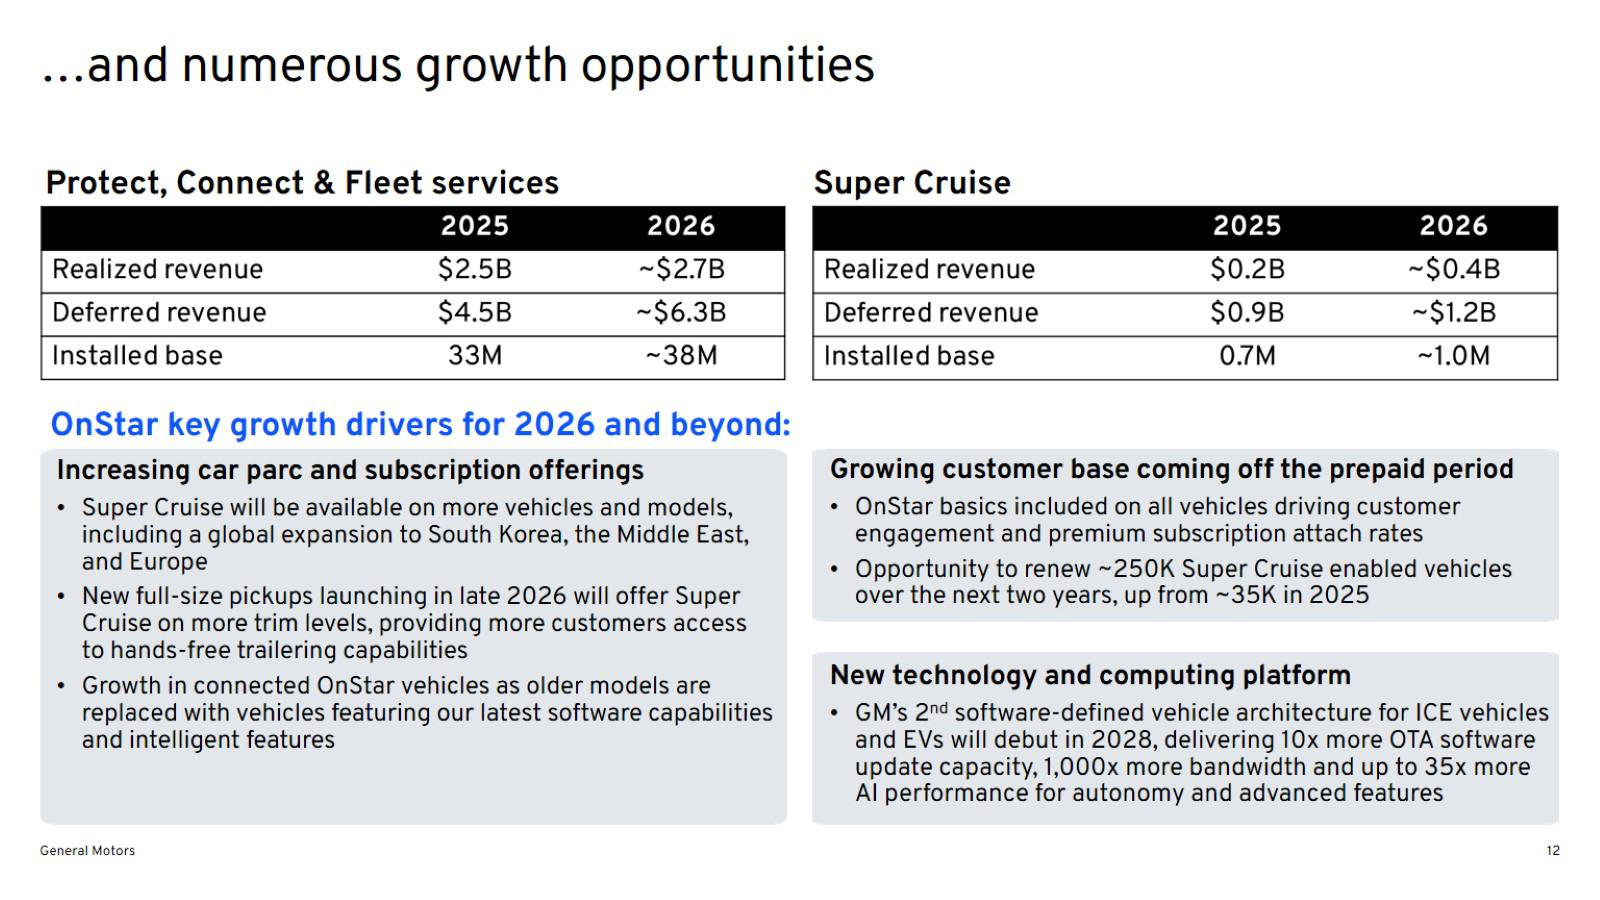
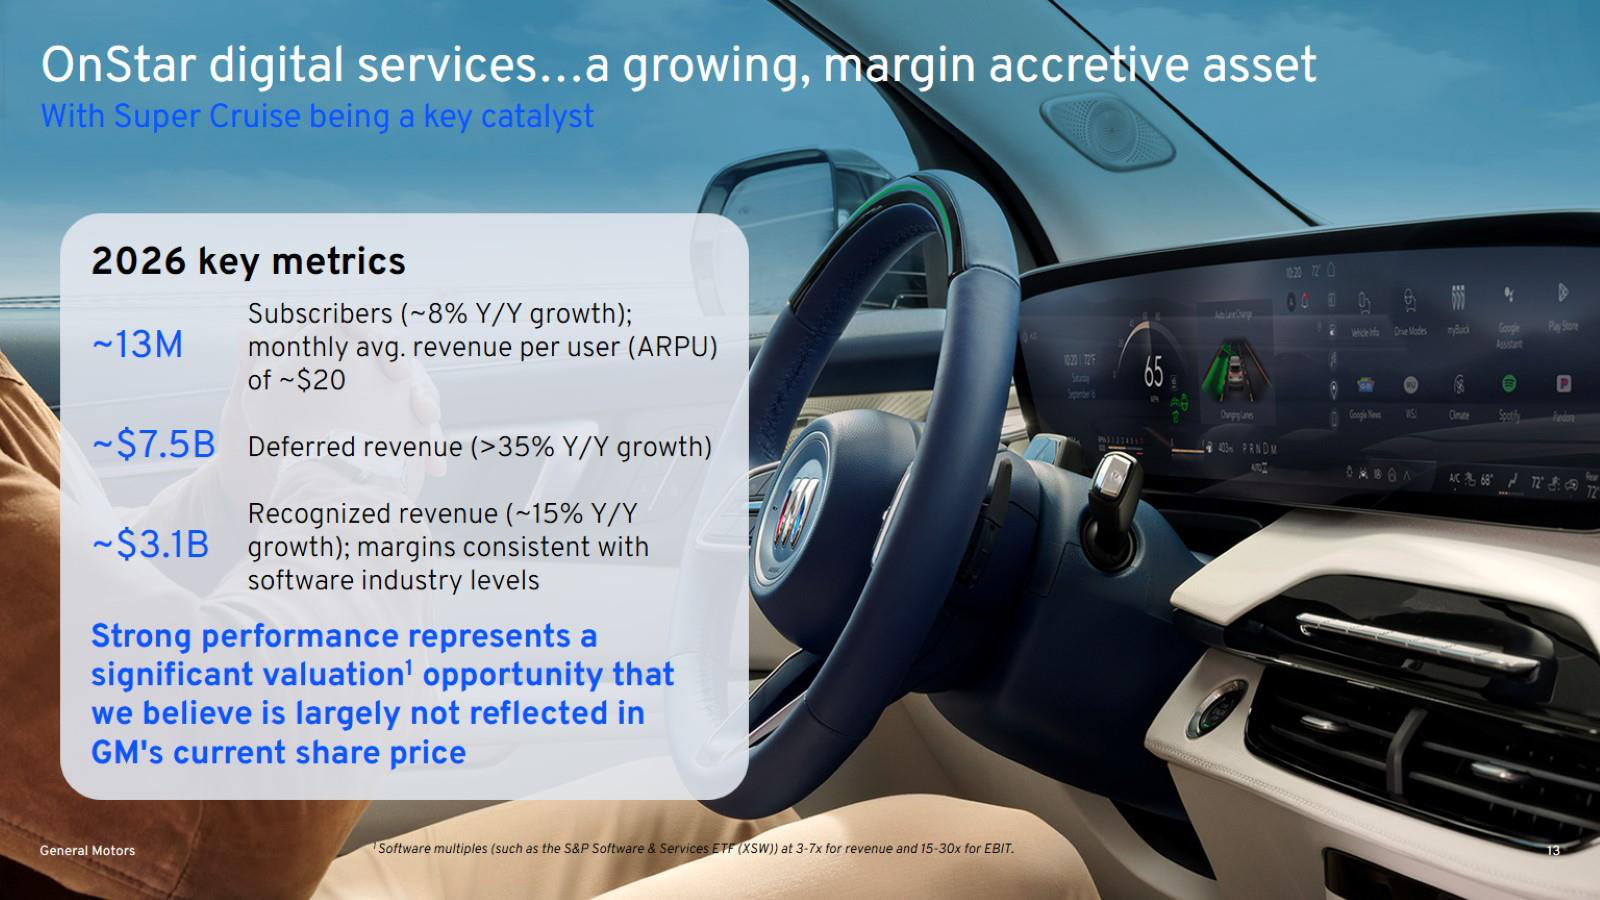
A standalone deck on OnStar and Super Cruise: what the subscription business is, how prepaid plans convert, and what it earns. · Open the full document →

A Stronger and More Resilient General Motors — 2025
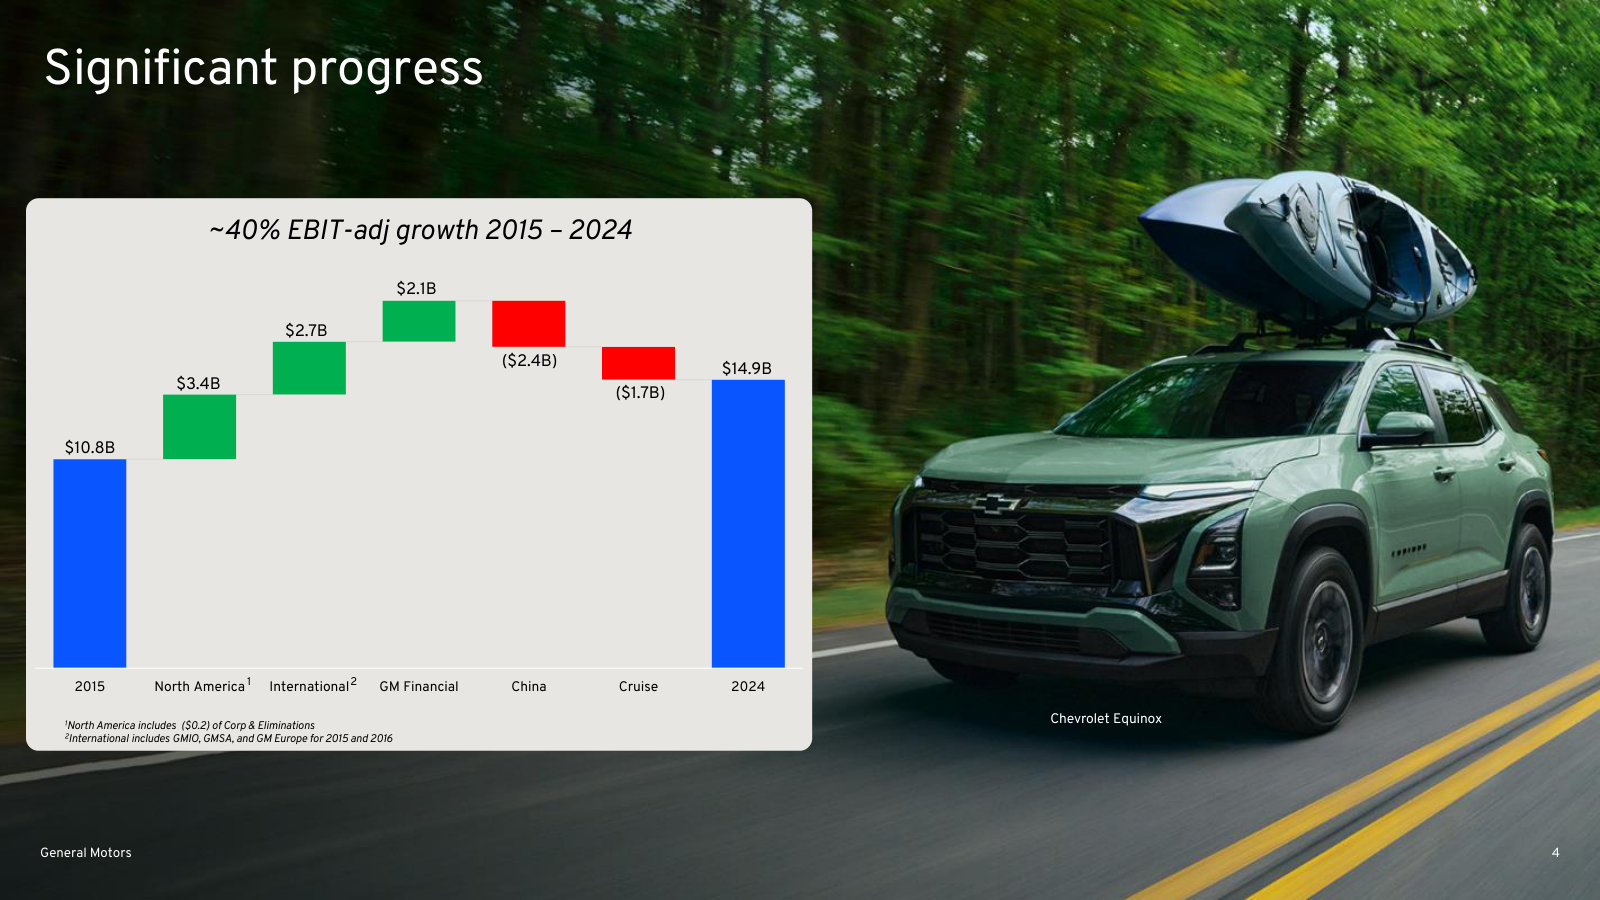
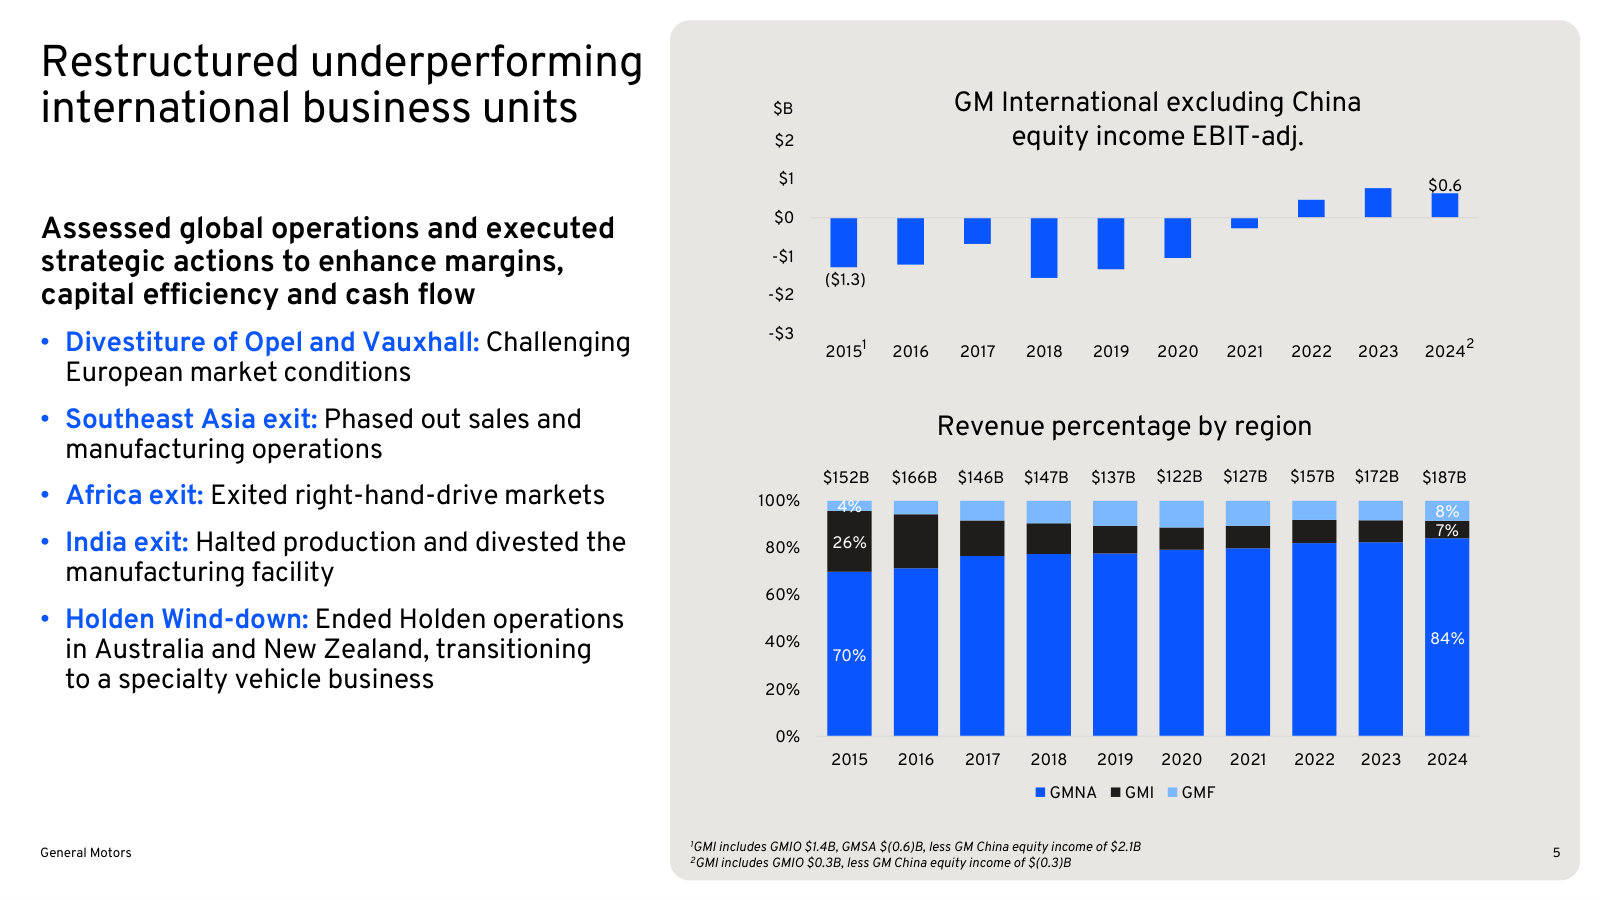
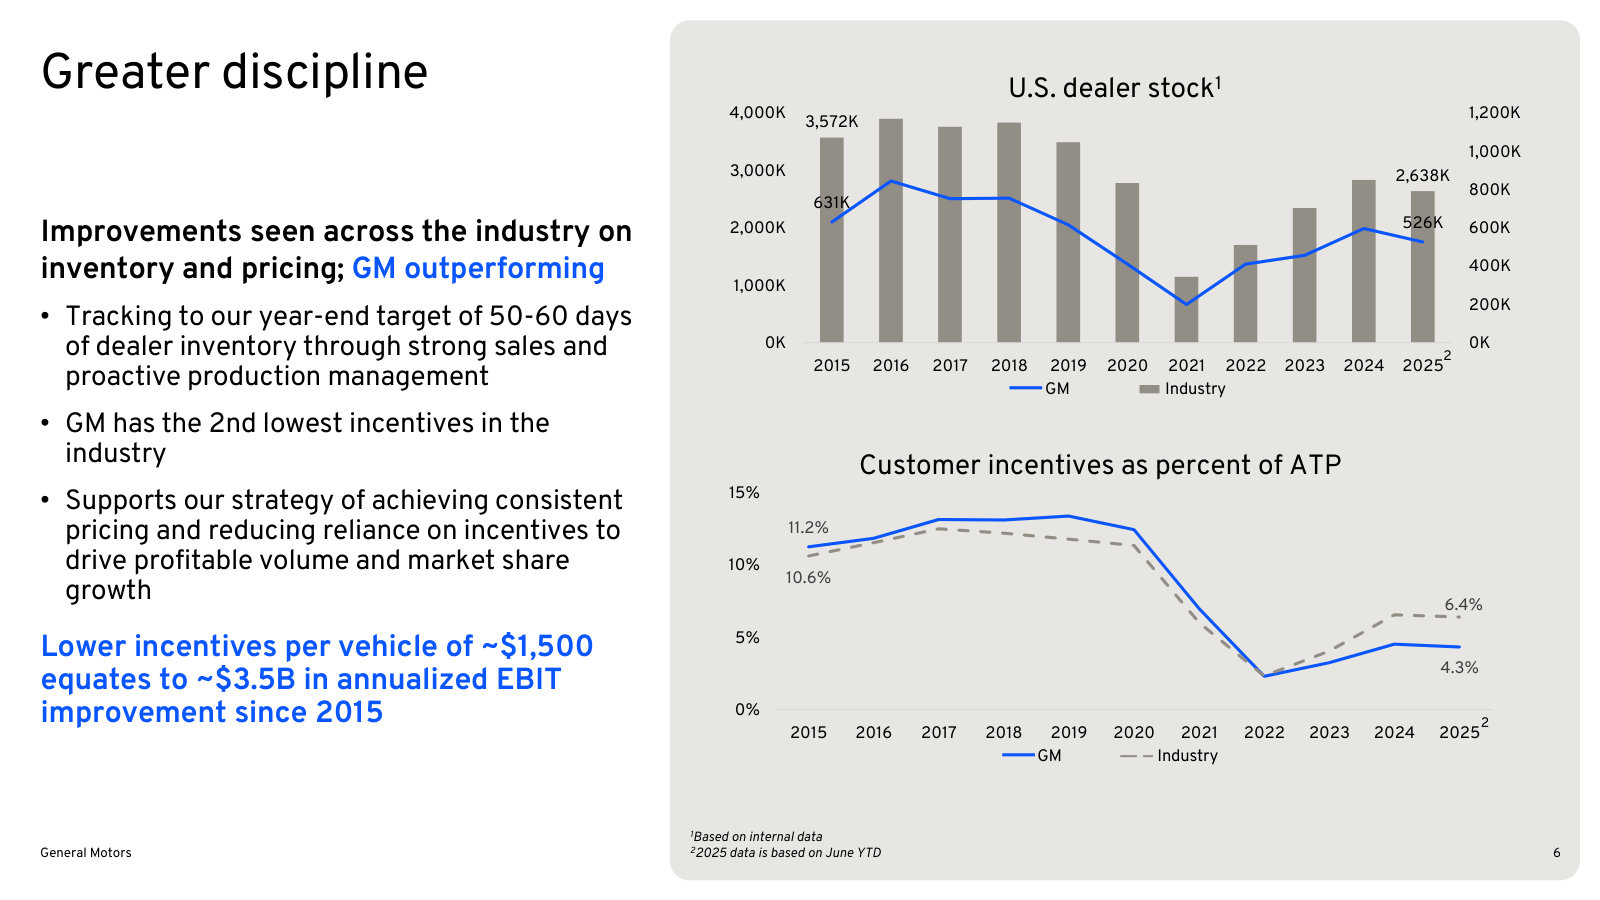
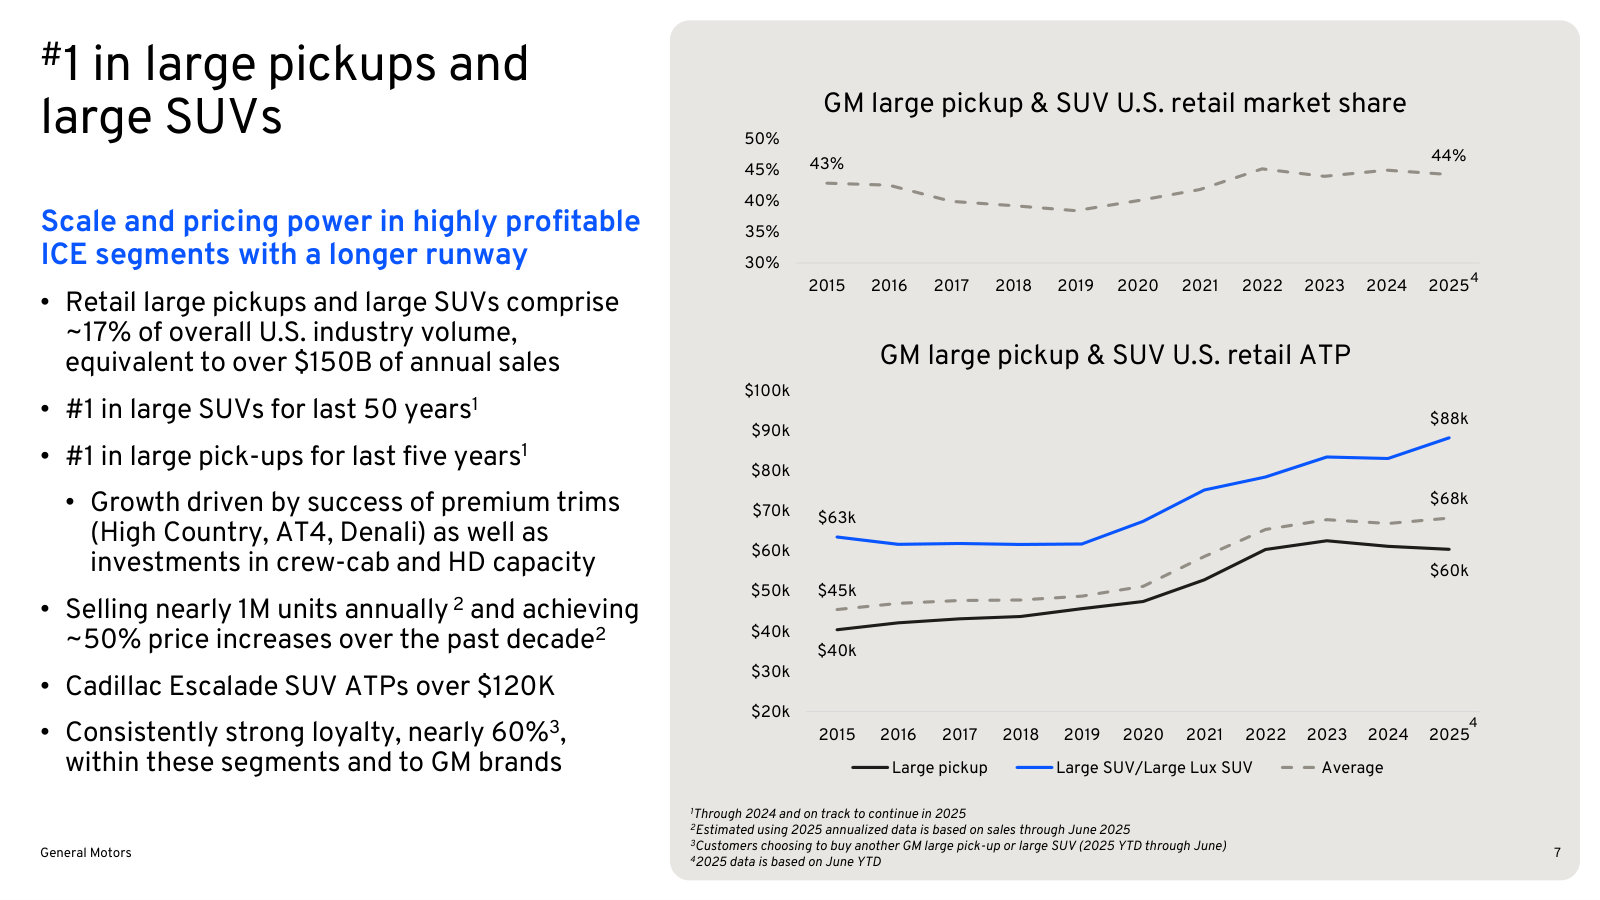
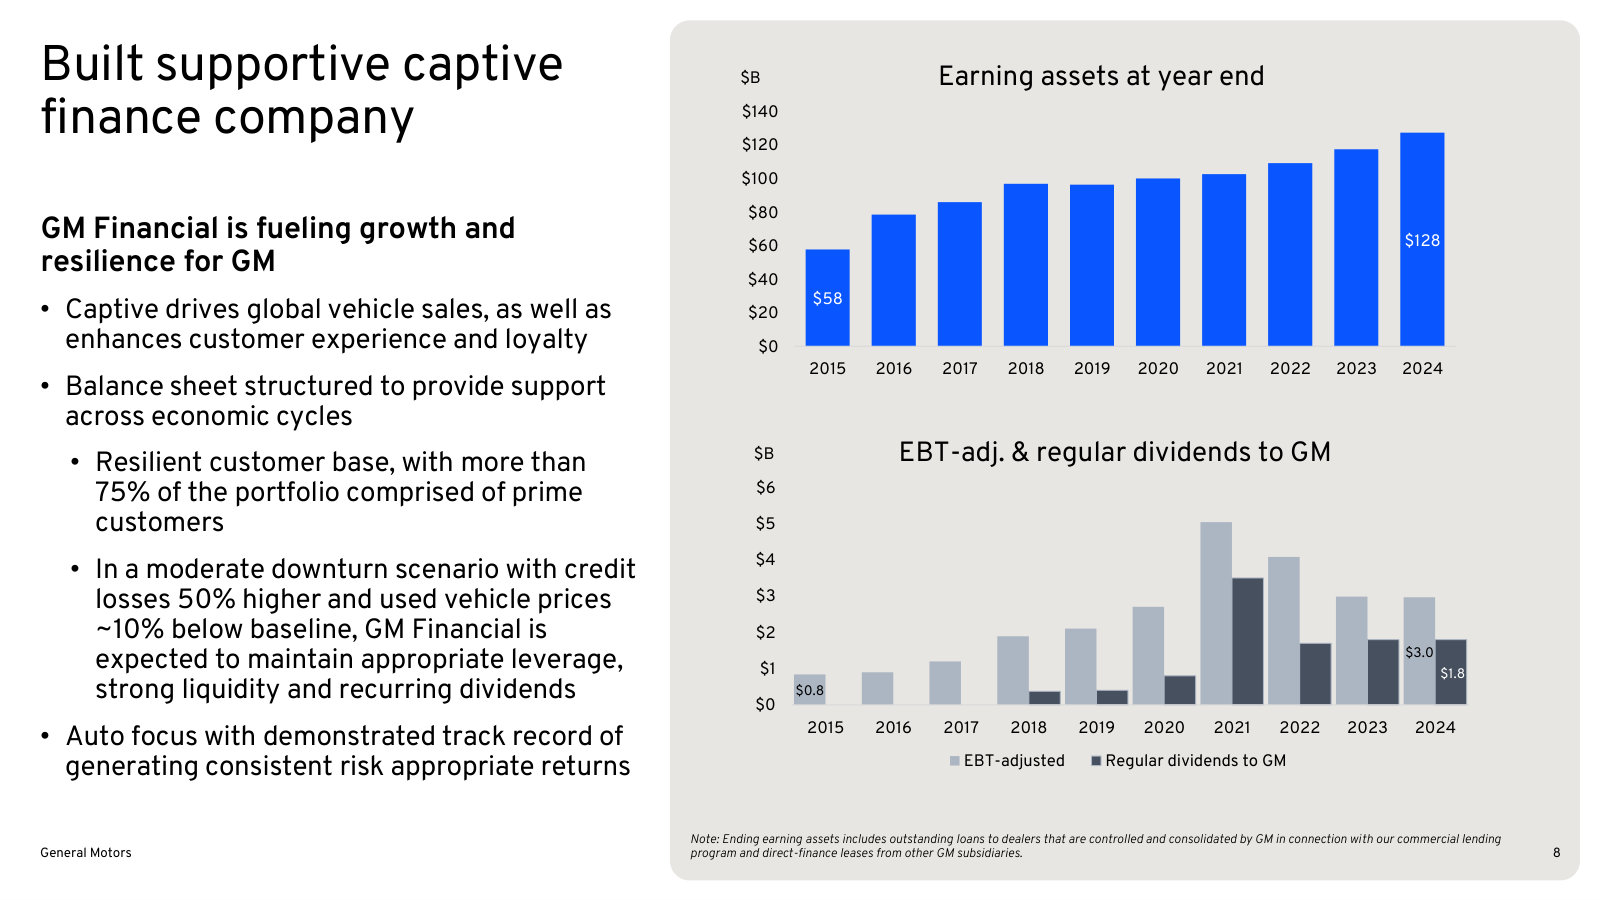
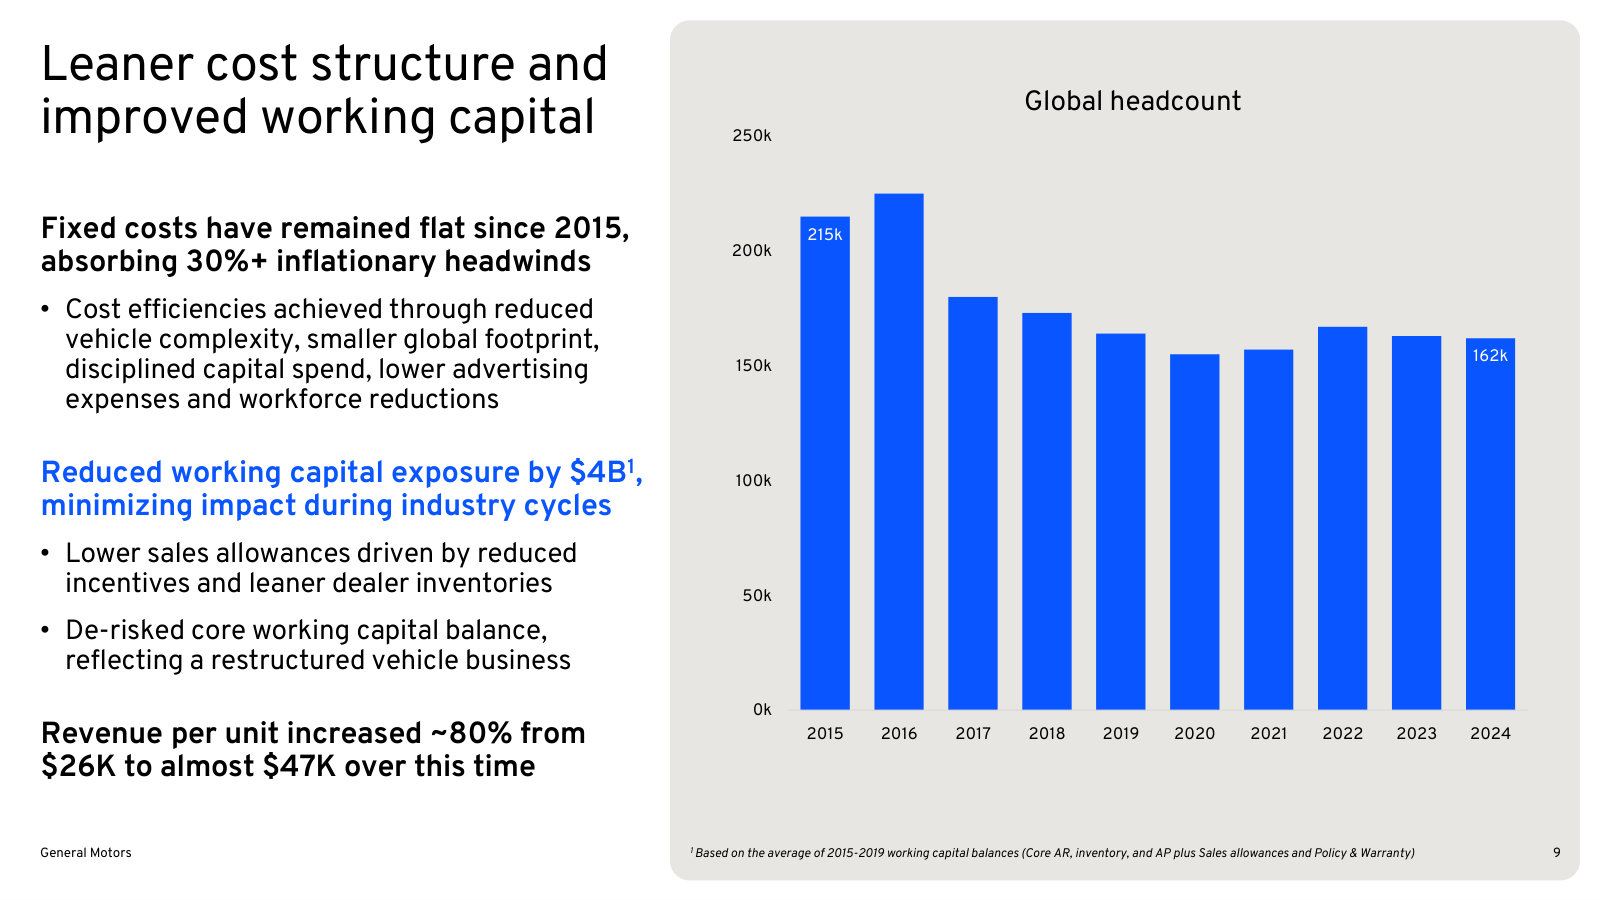
The clearest overview of how GM makes money: a decade of restructuring, pricing, the captive finance arm and capital returns. · Open the full document →
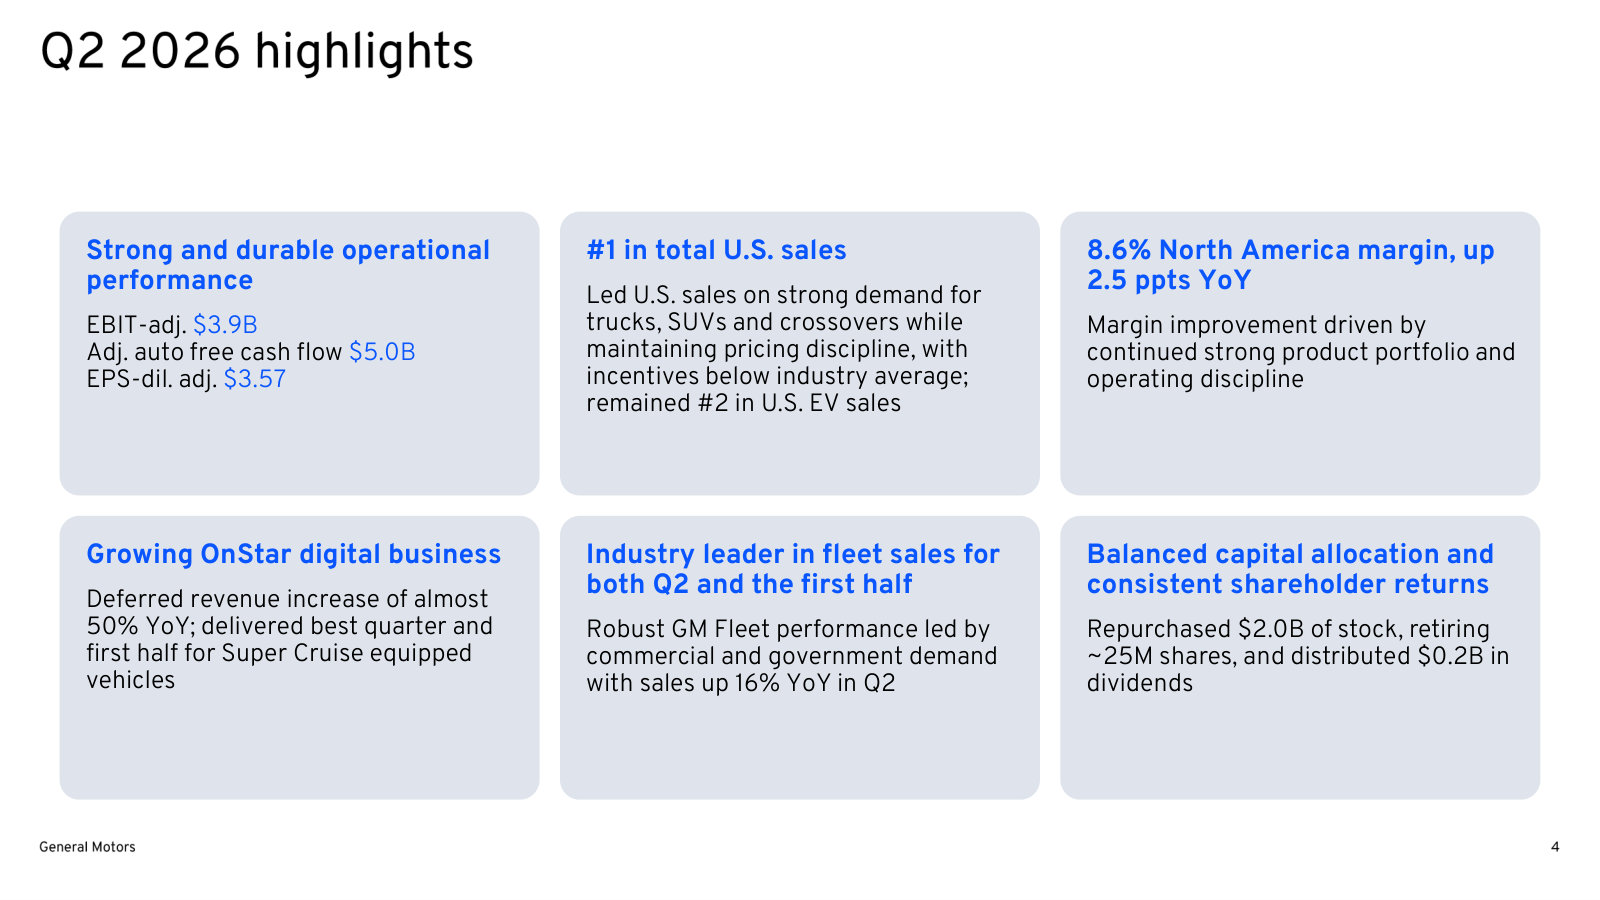
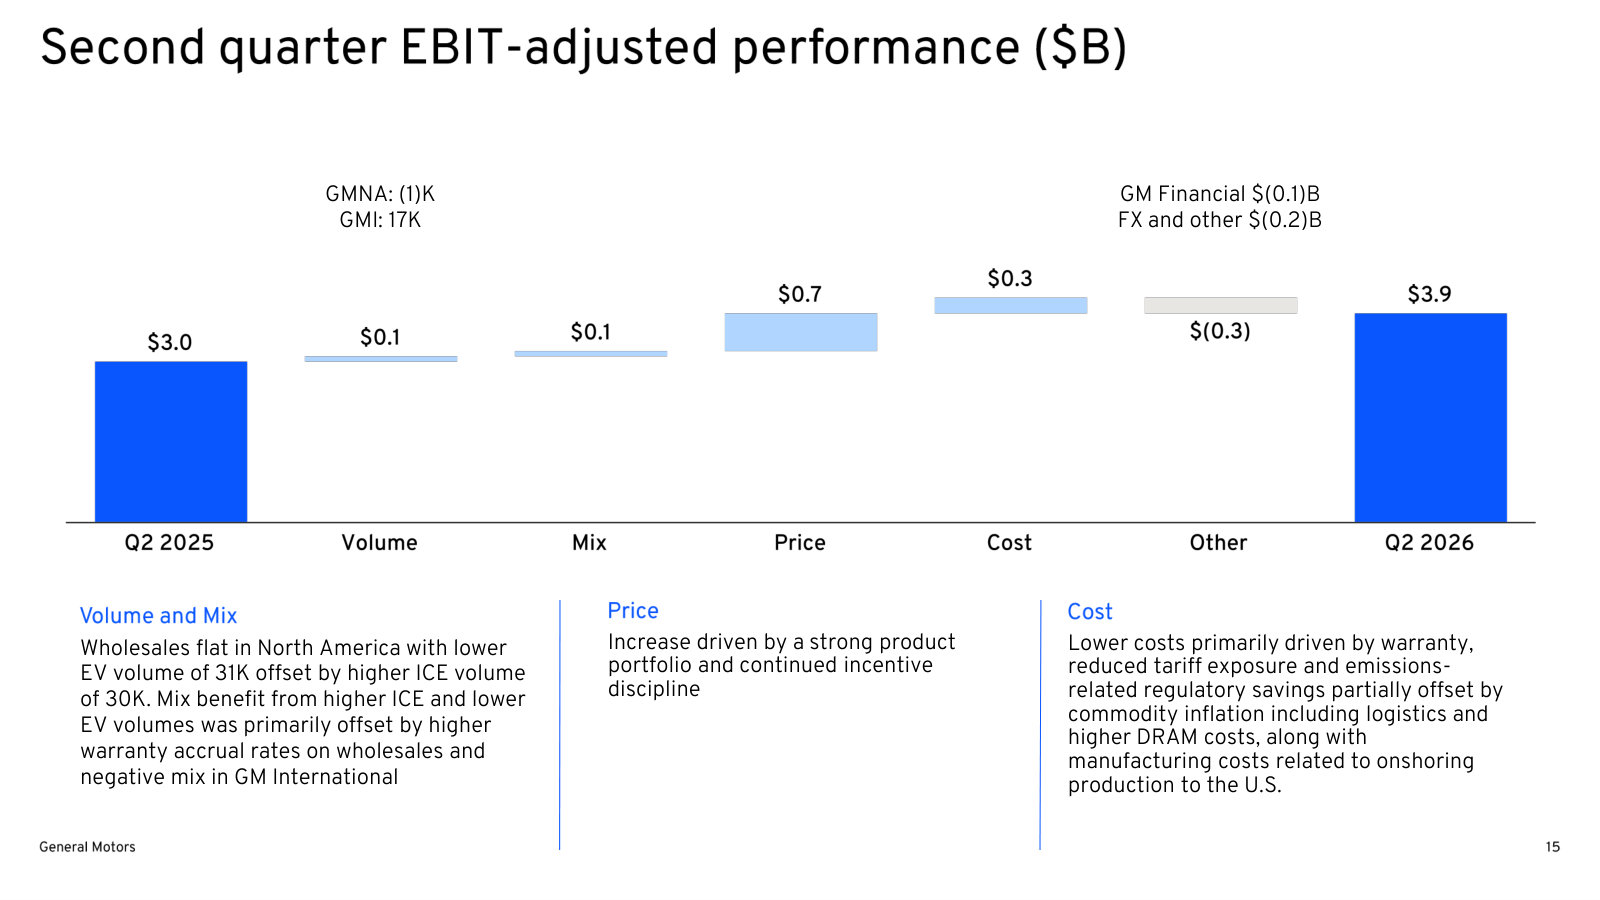
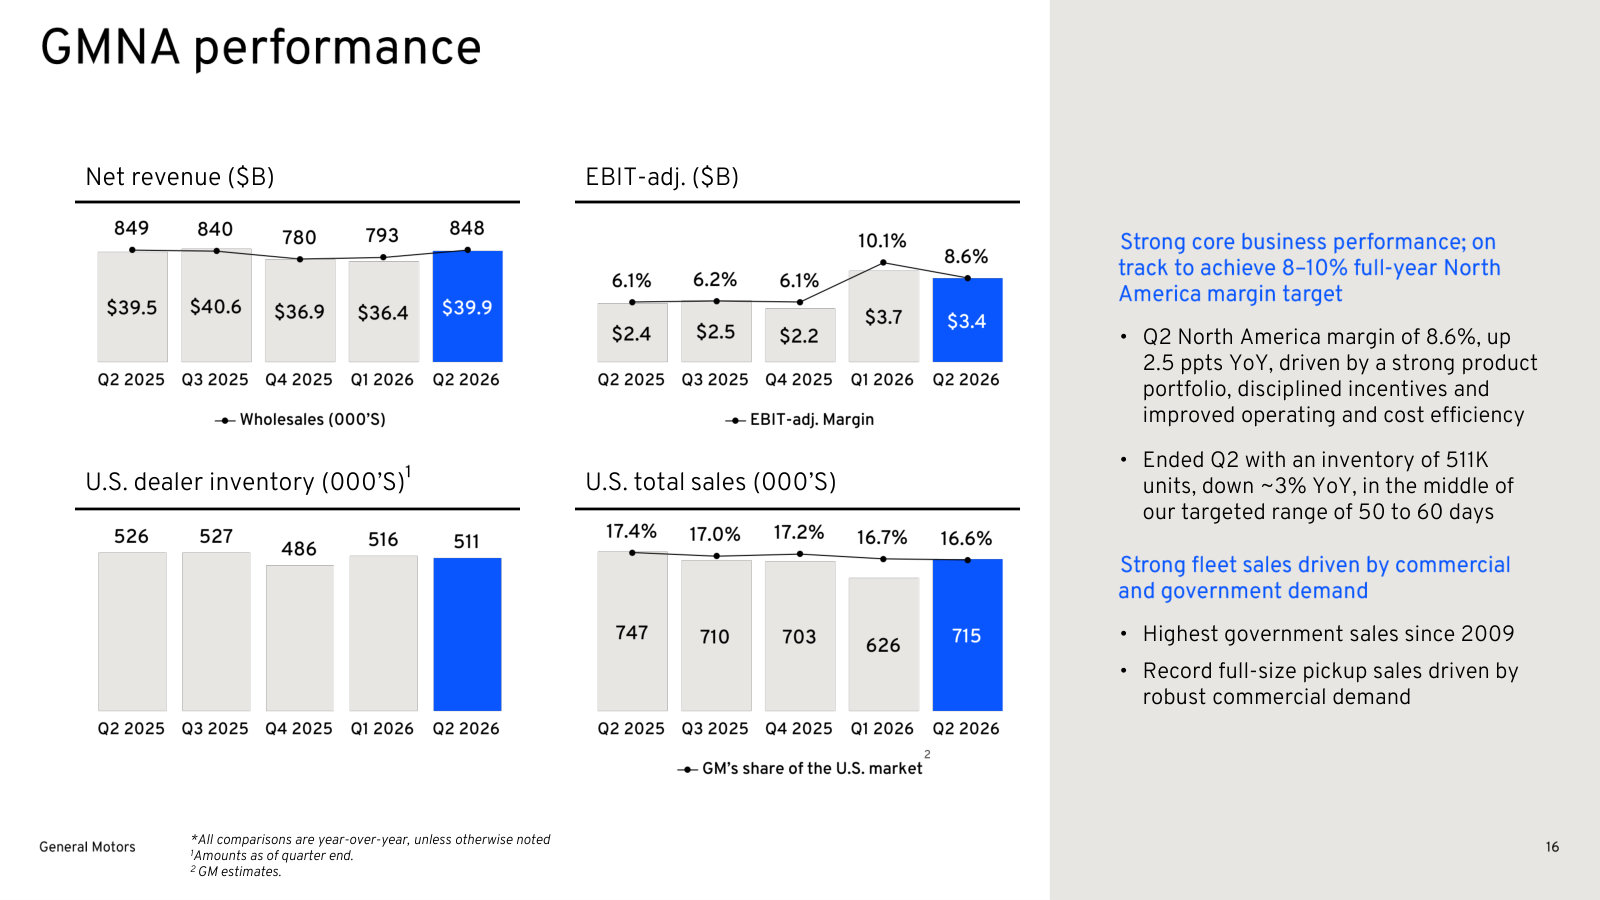
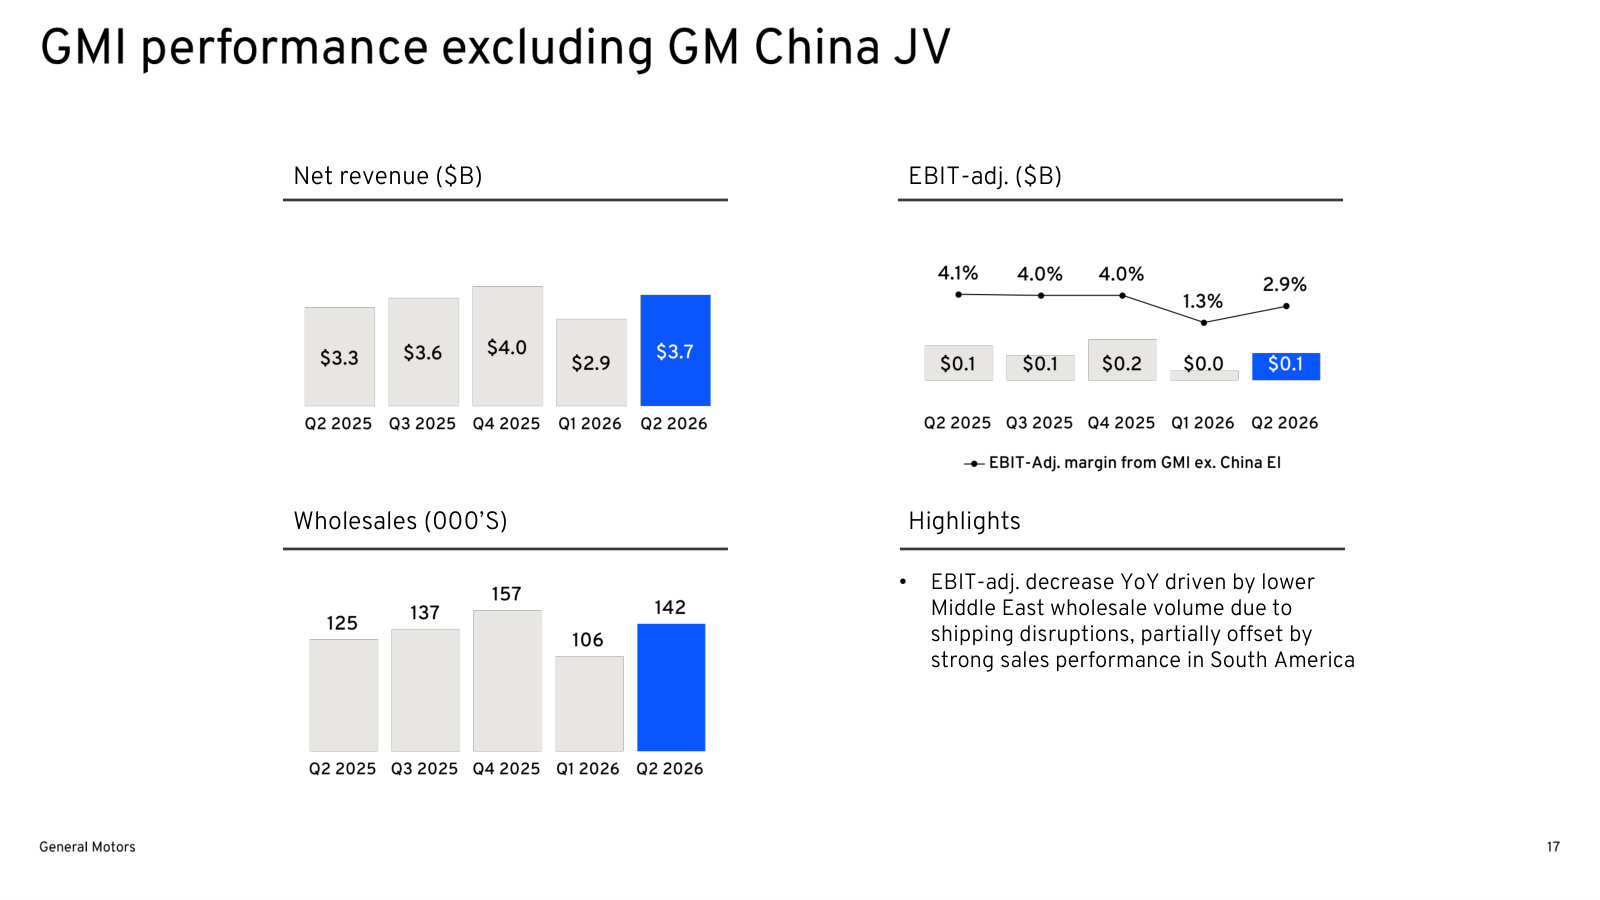
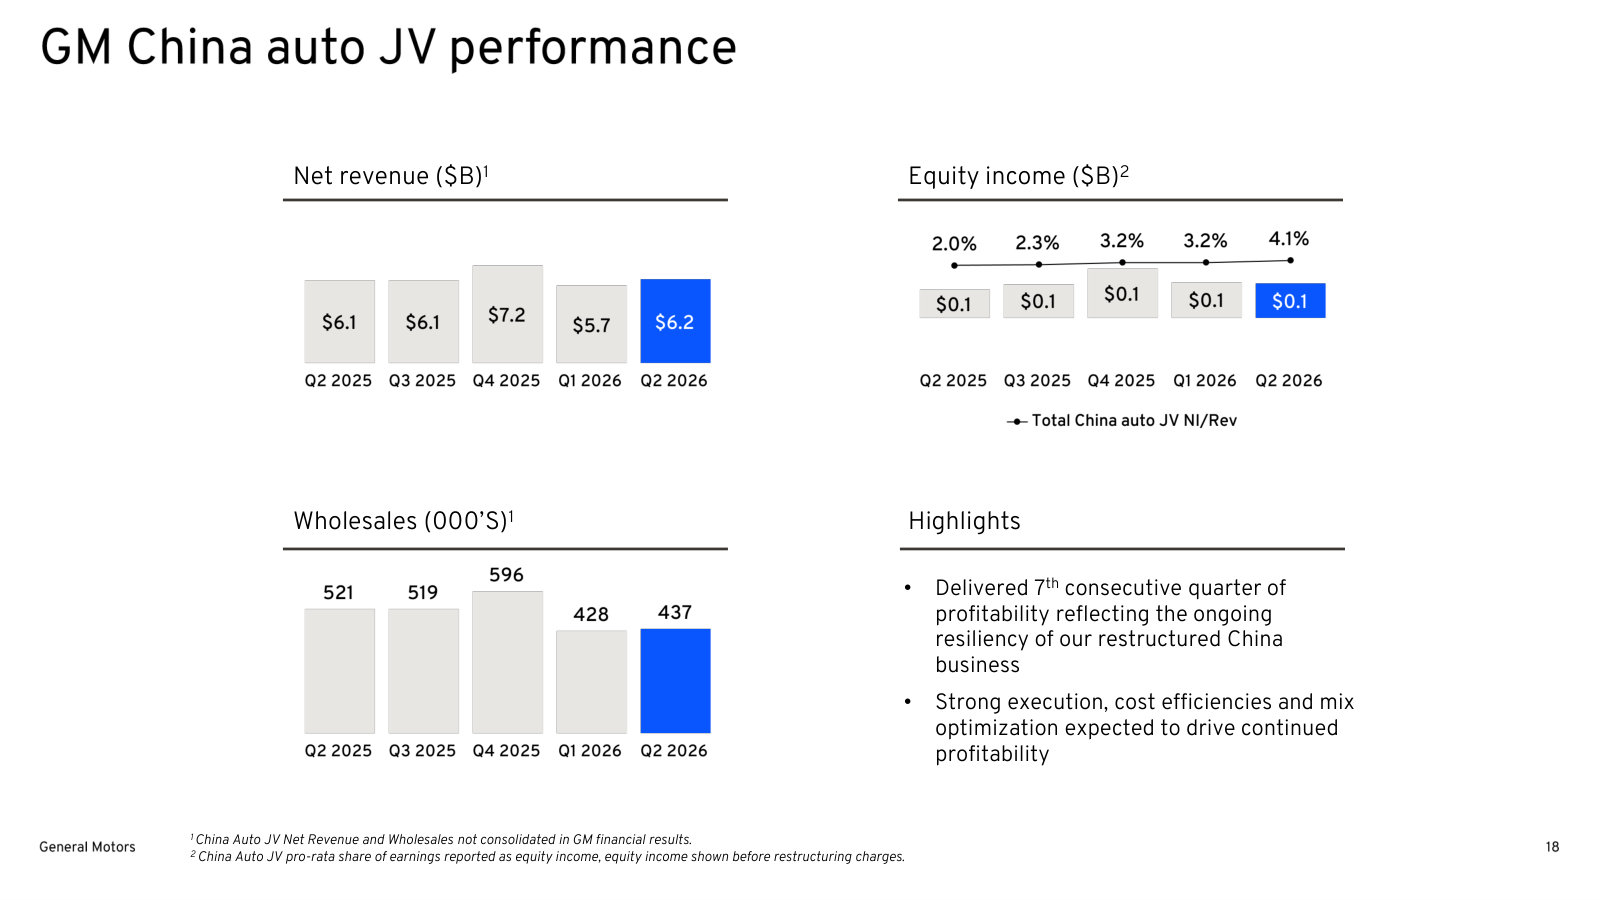
Q2 2026 Earnings Presentation — Q2 2026
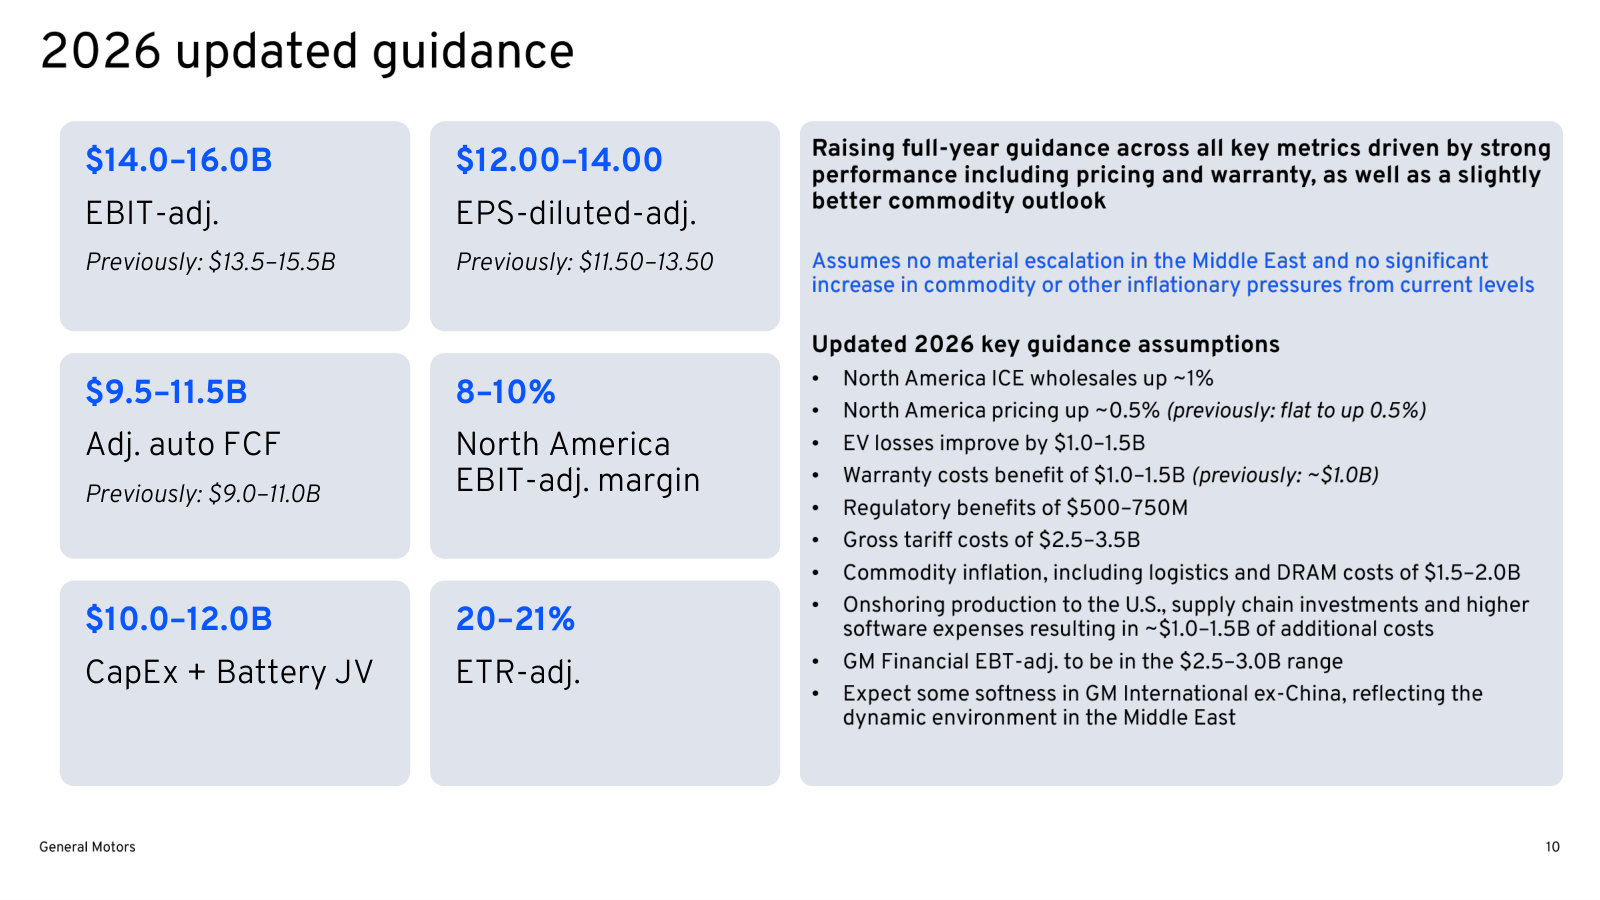
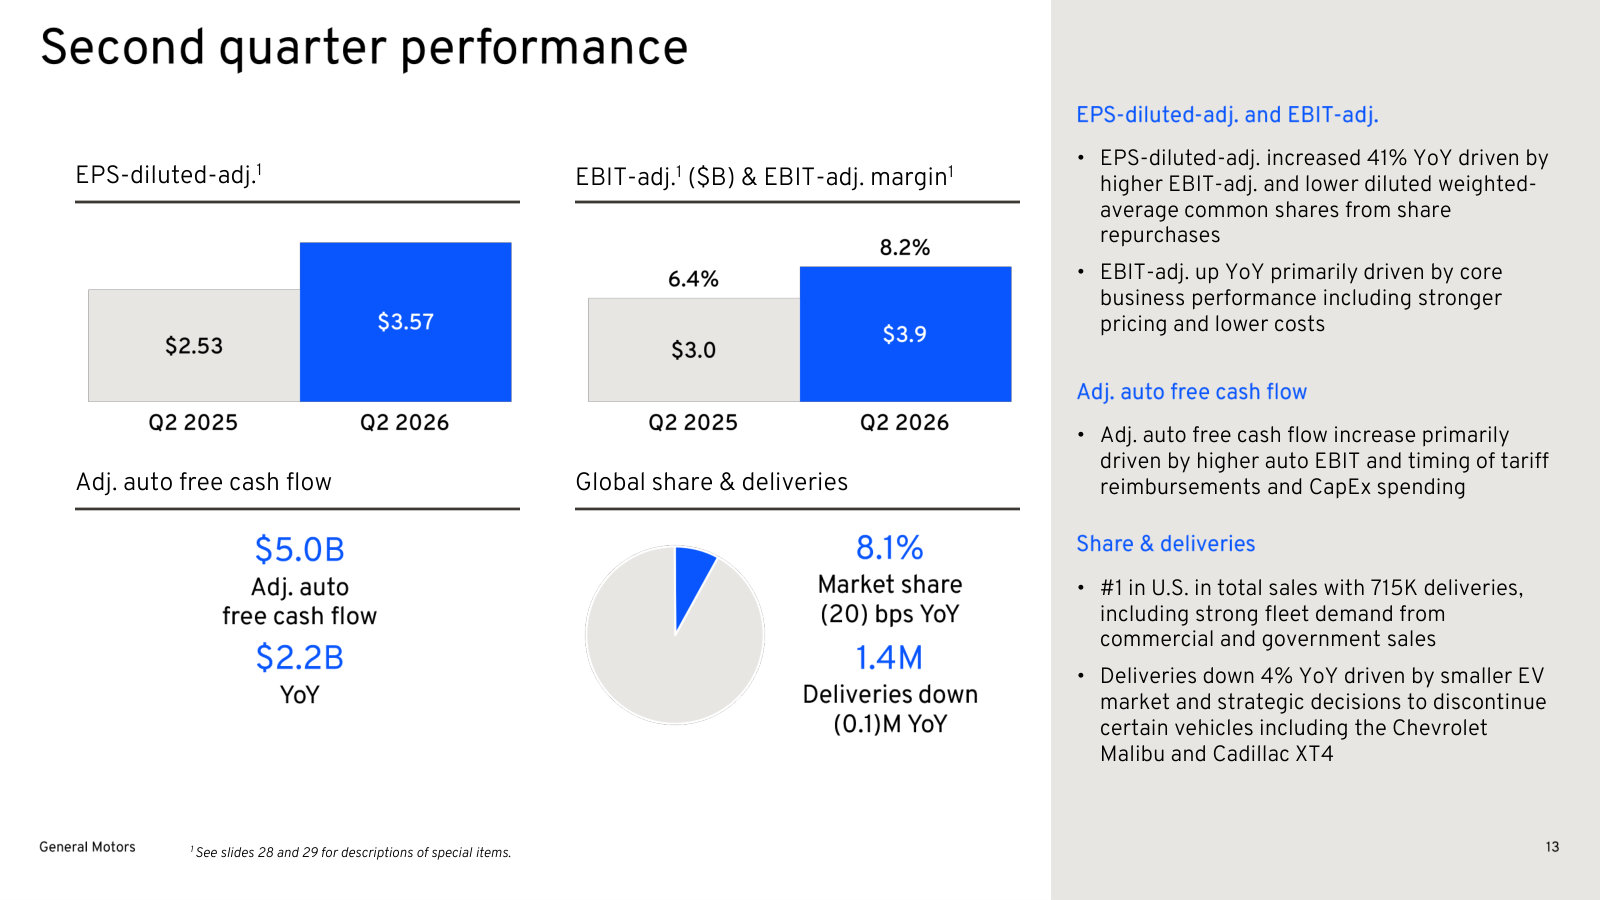
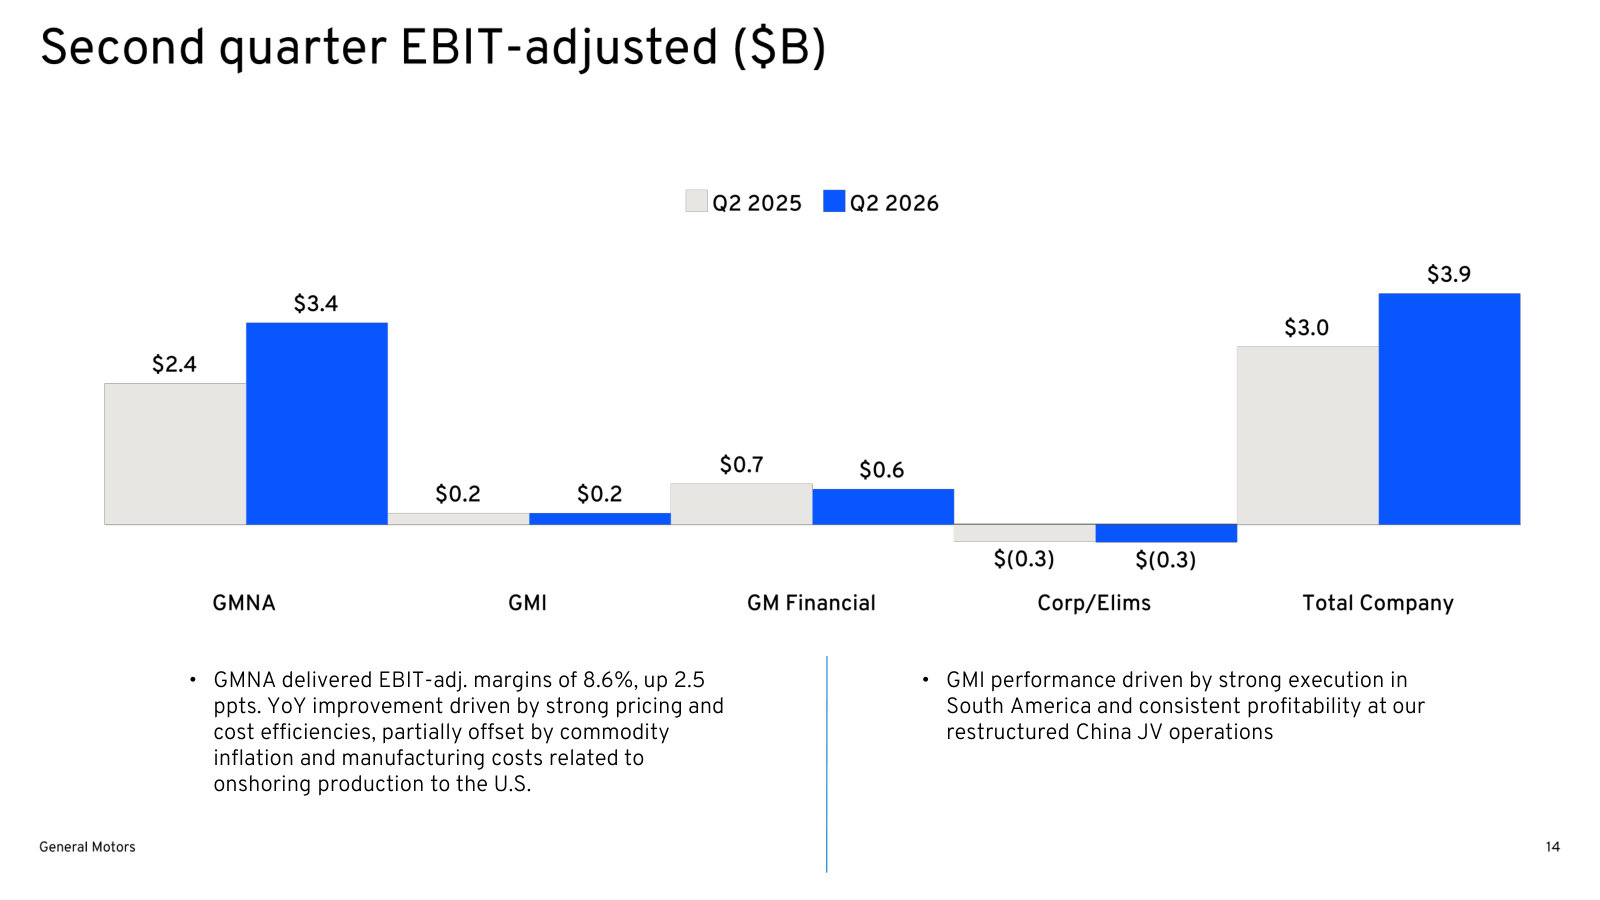
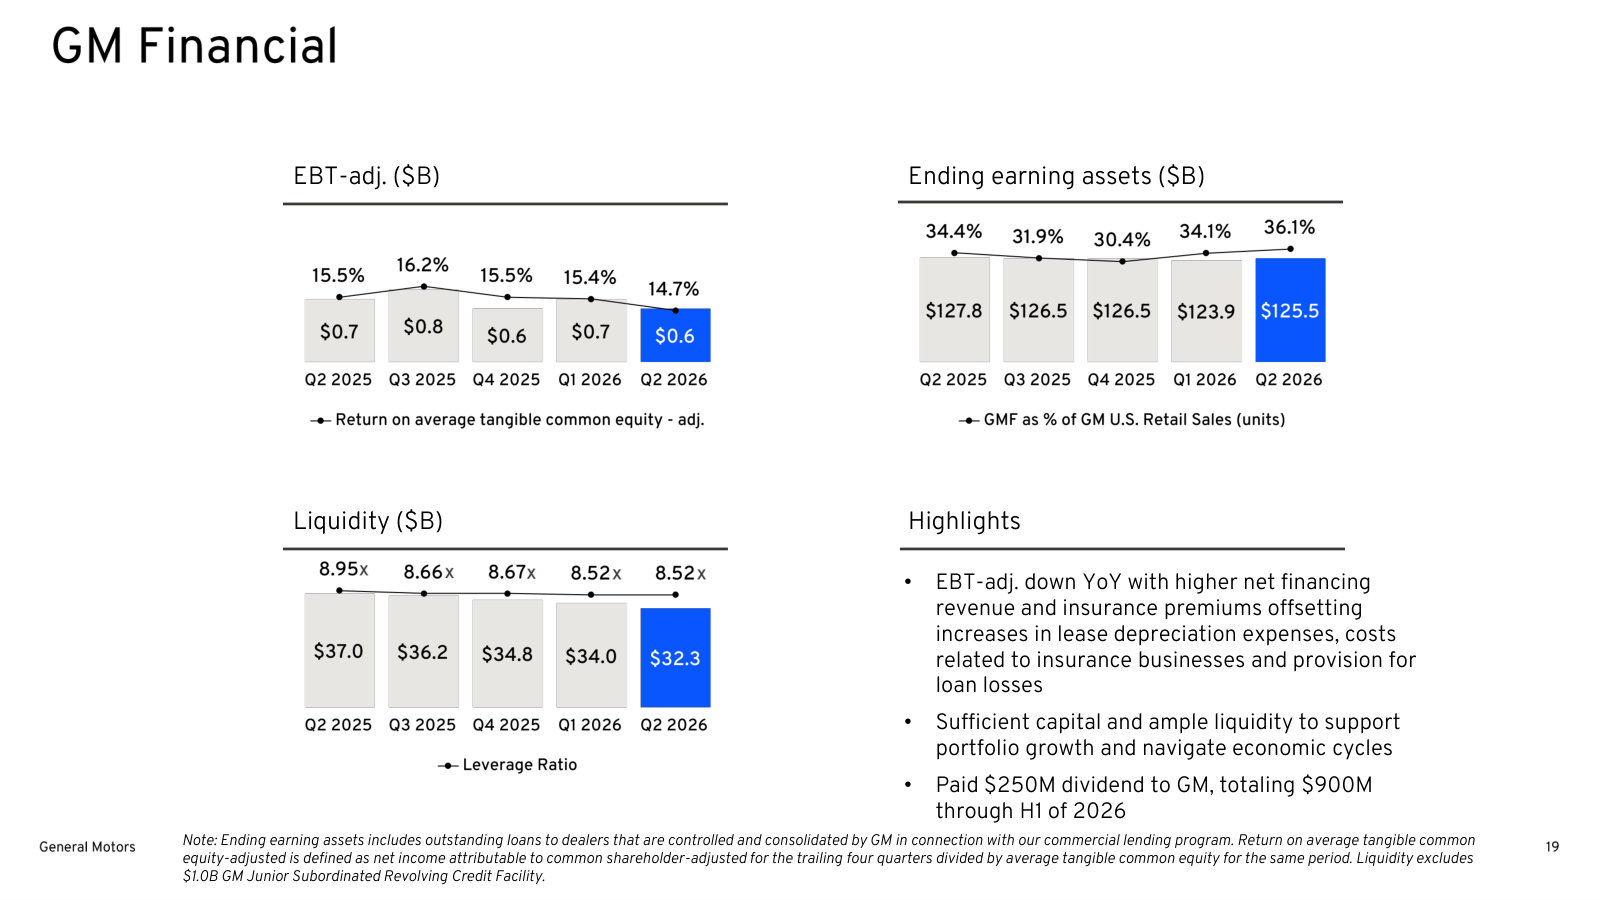
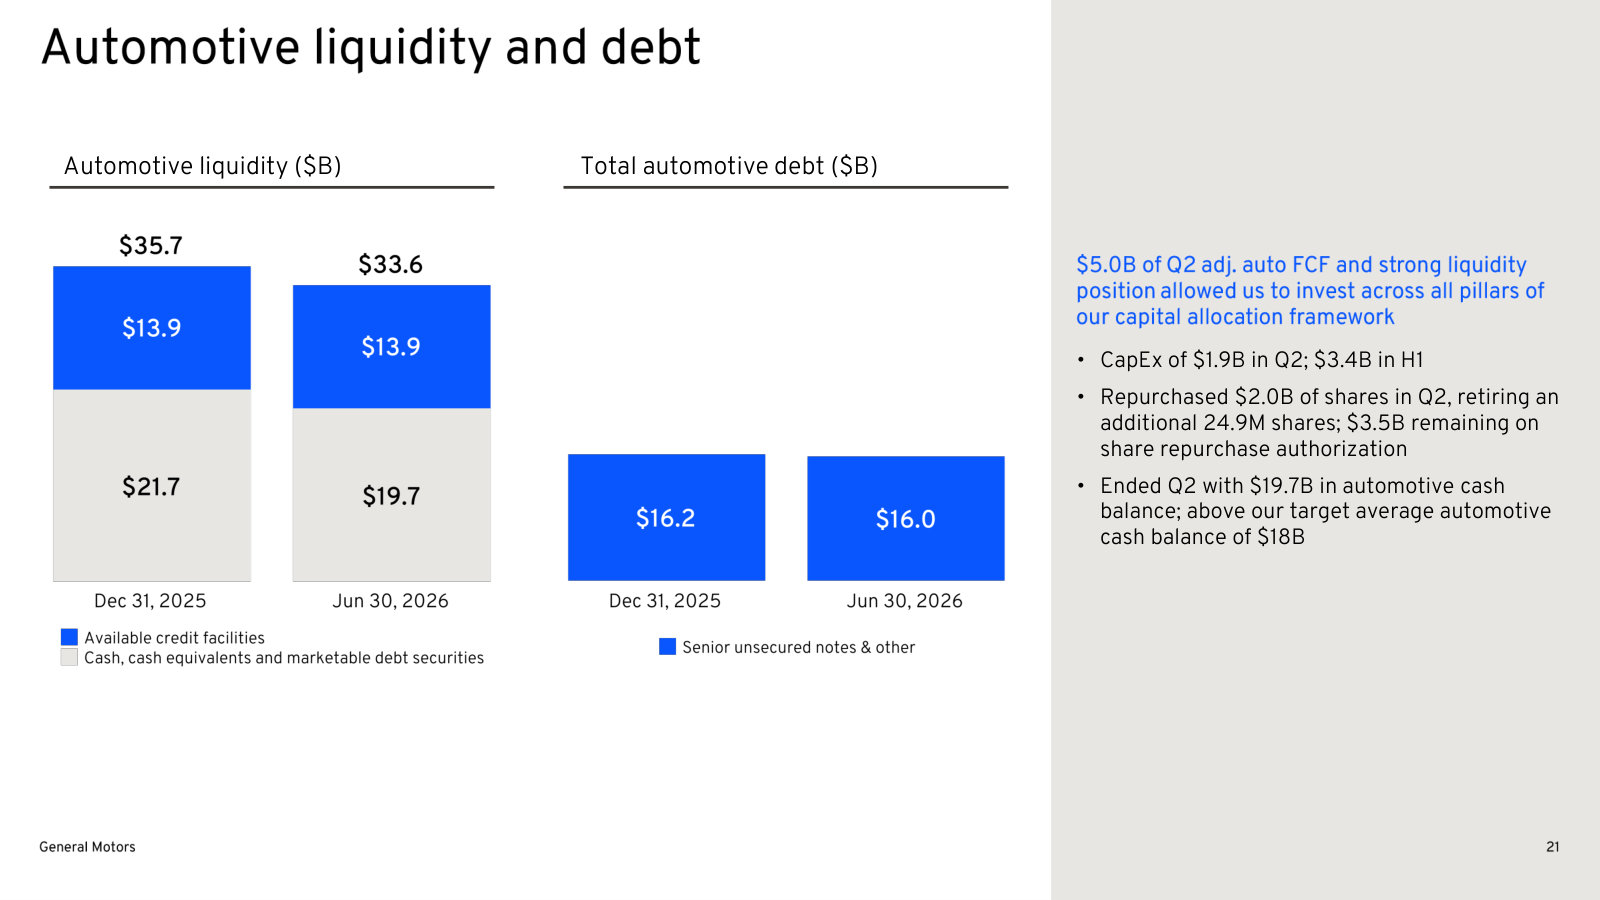
The most recent quarter: current segment economics, the cost of the EV wind-down, and the 2026 guidance now in force. · Open the full document →
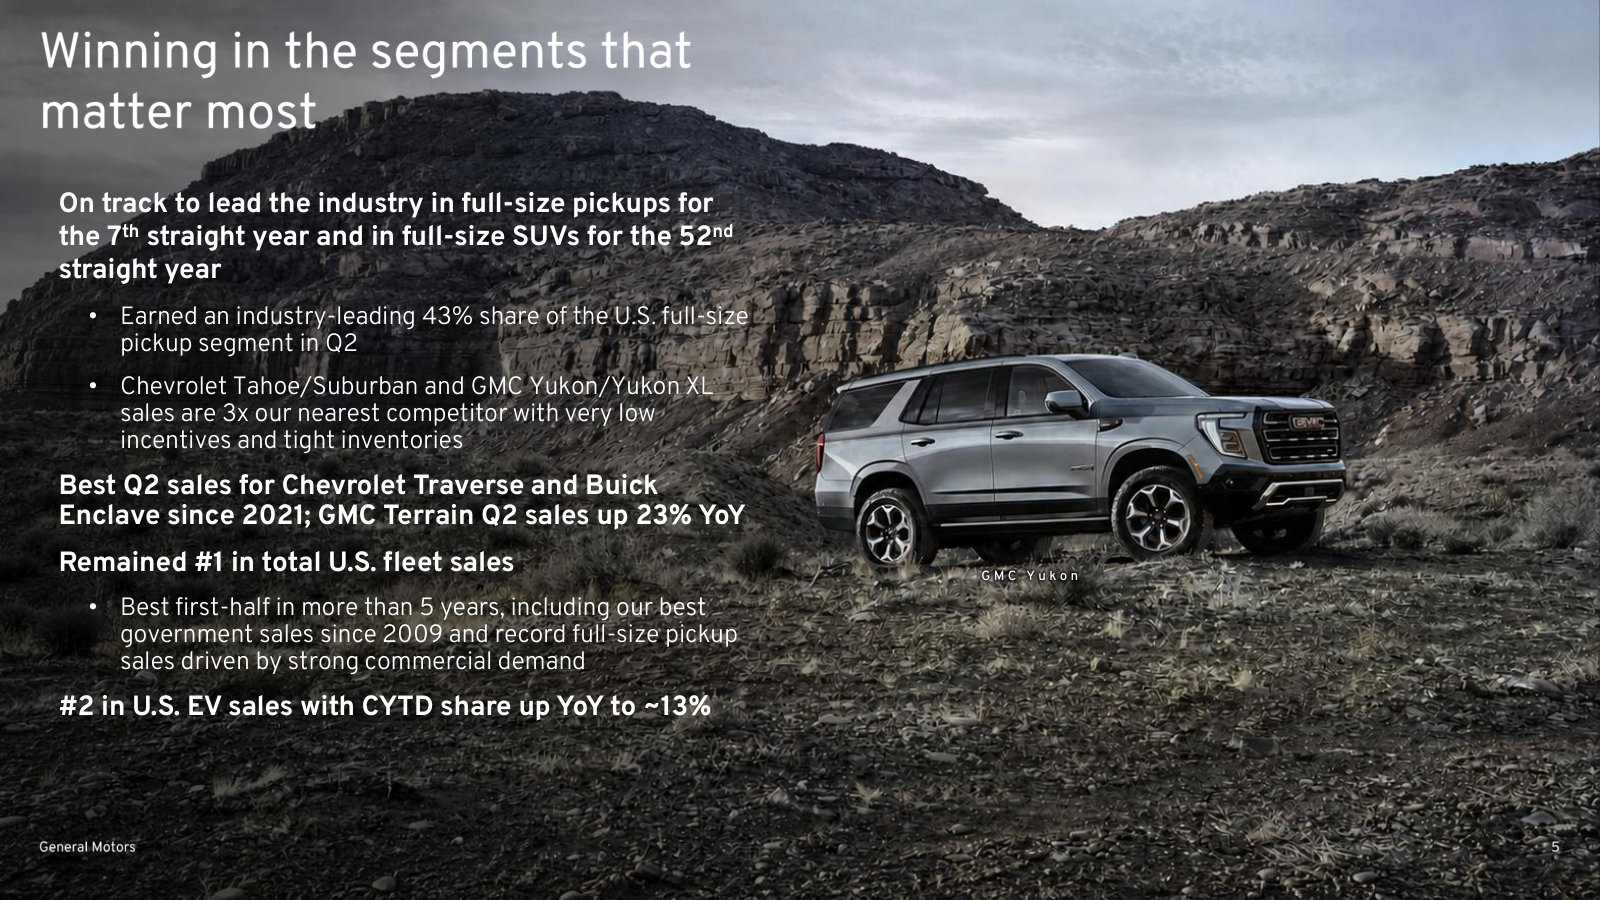
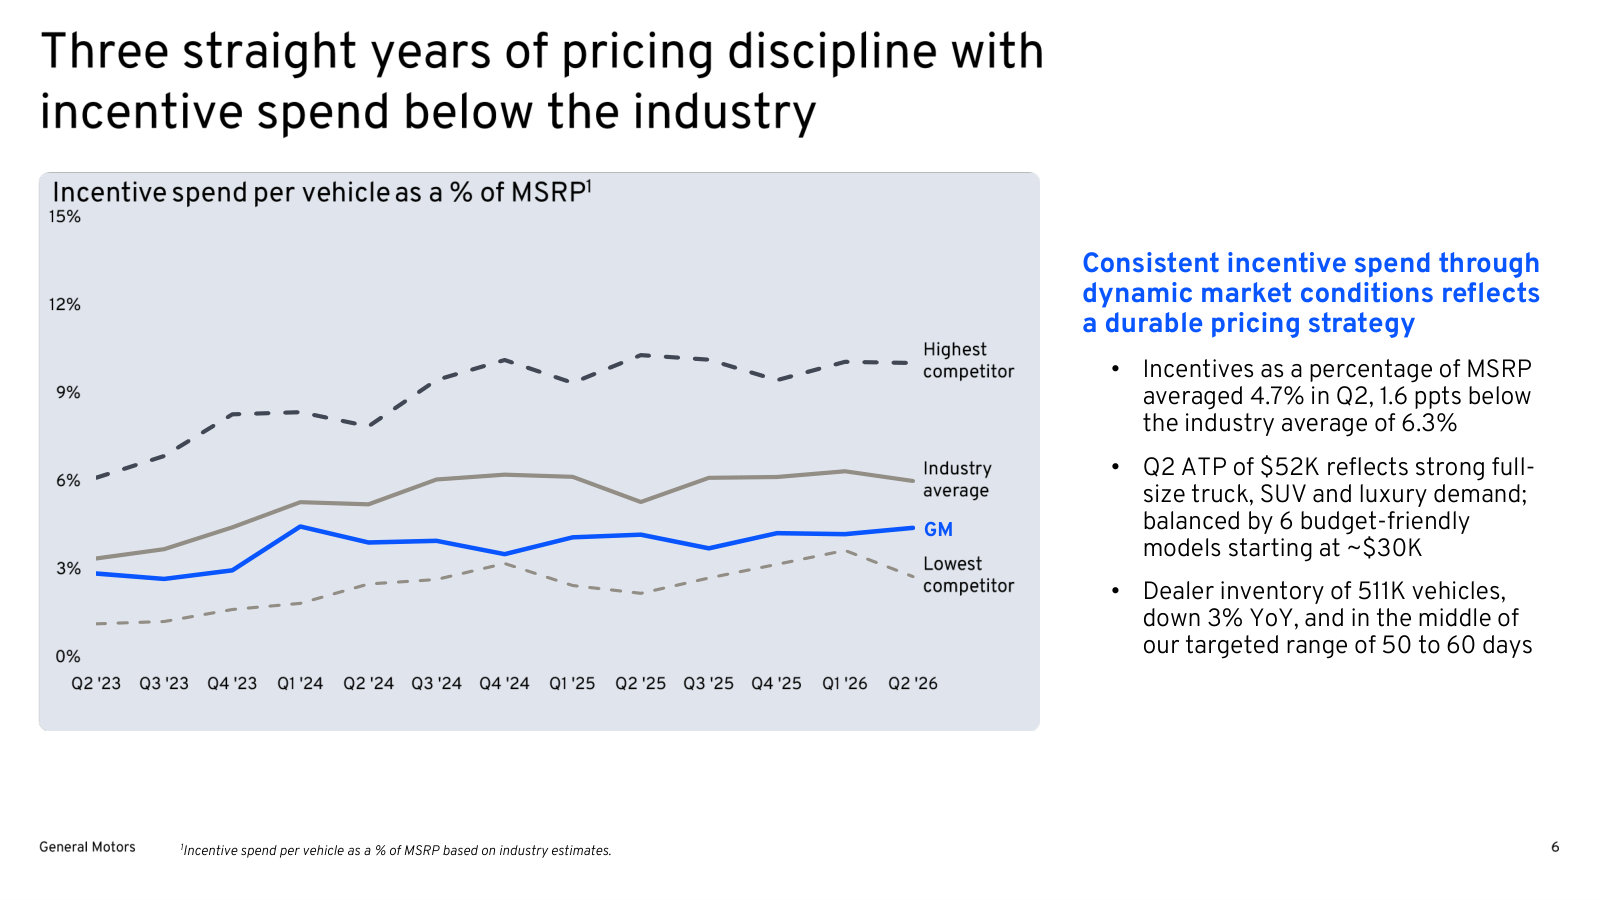
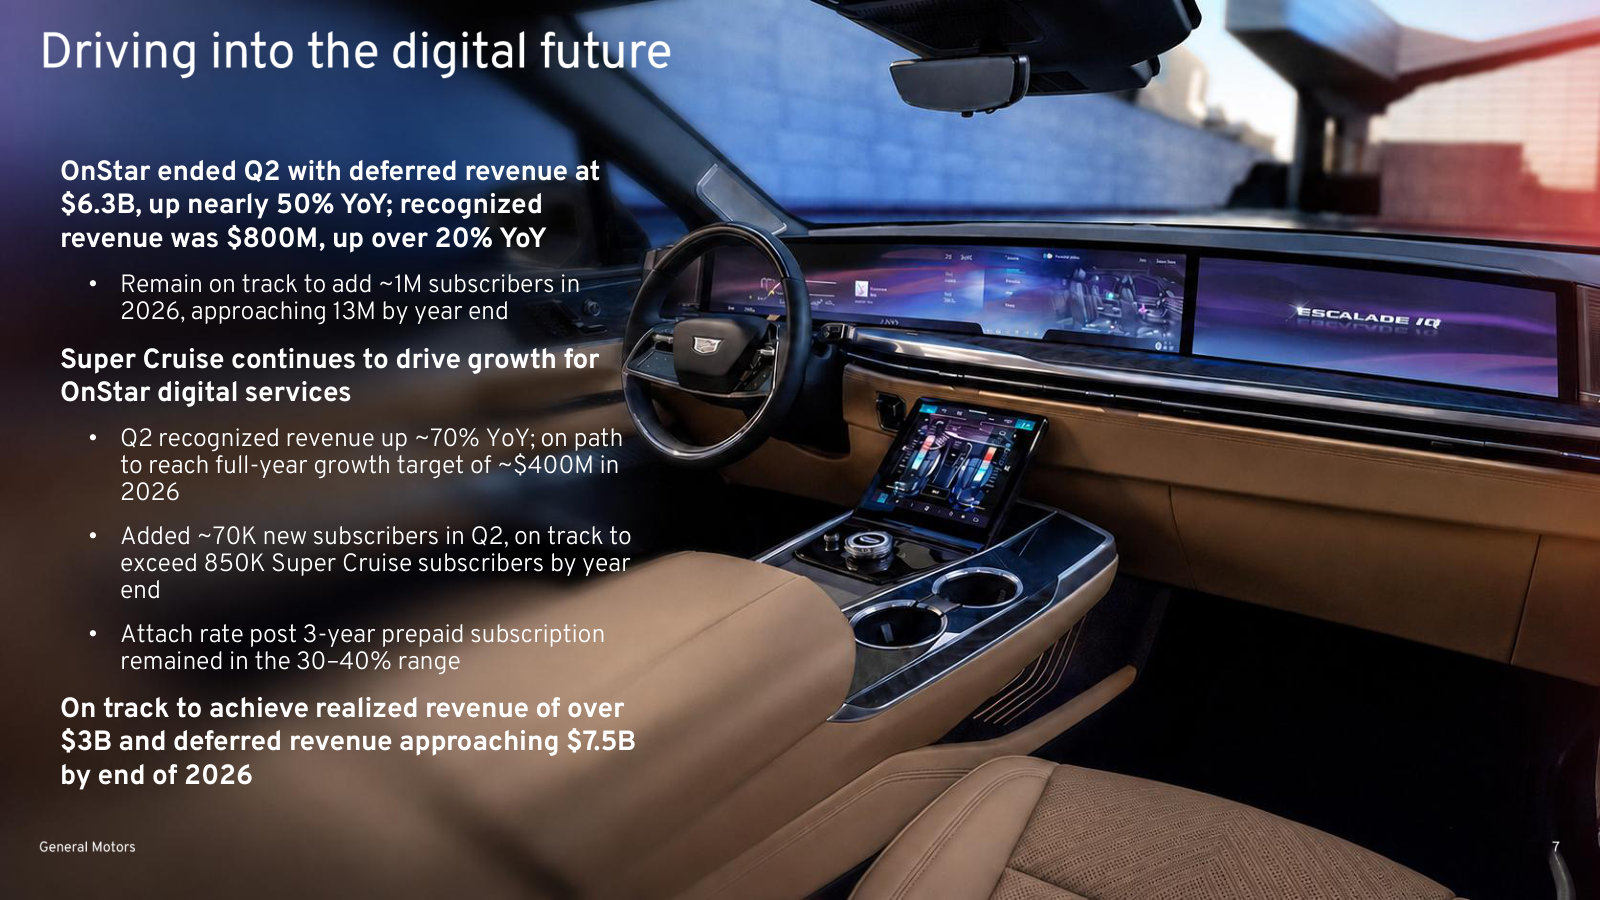
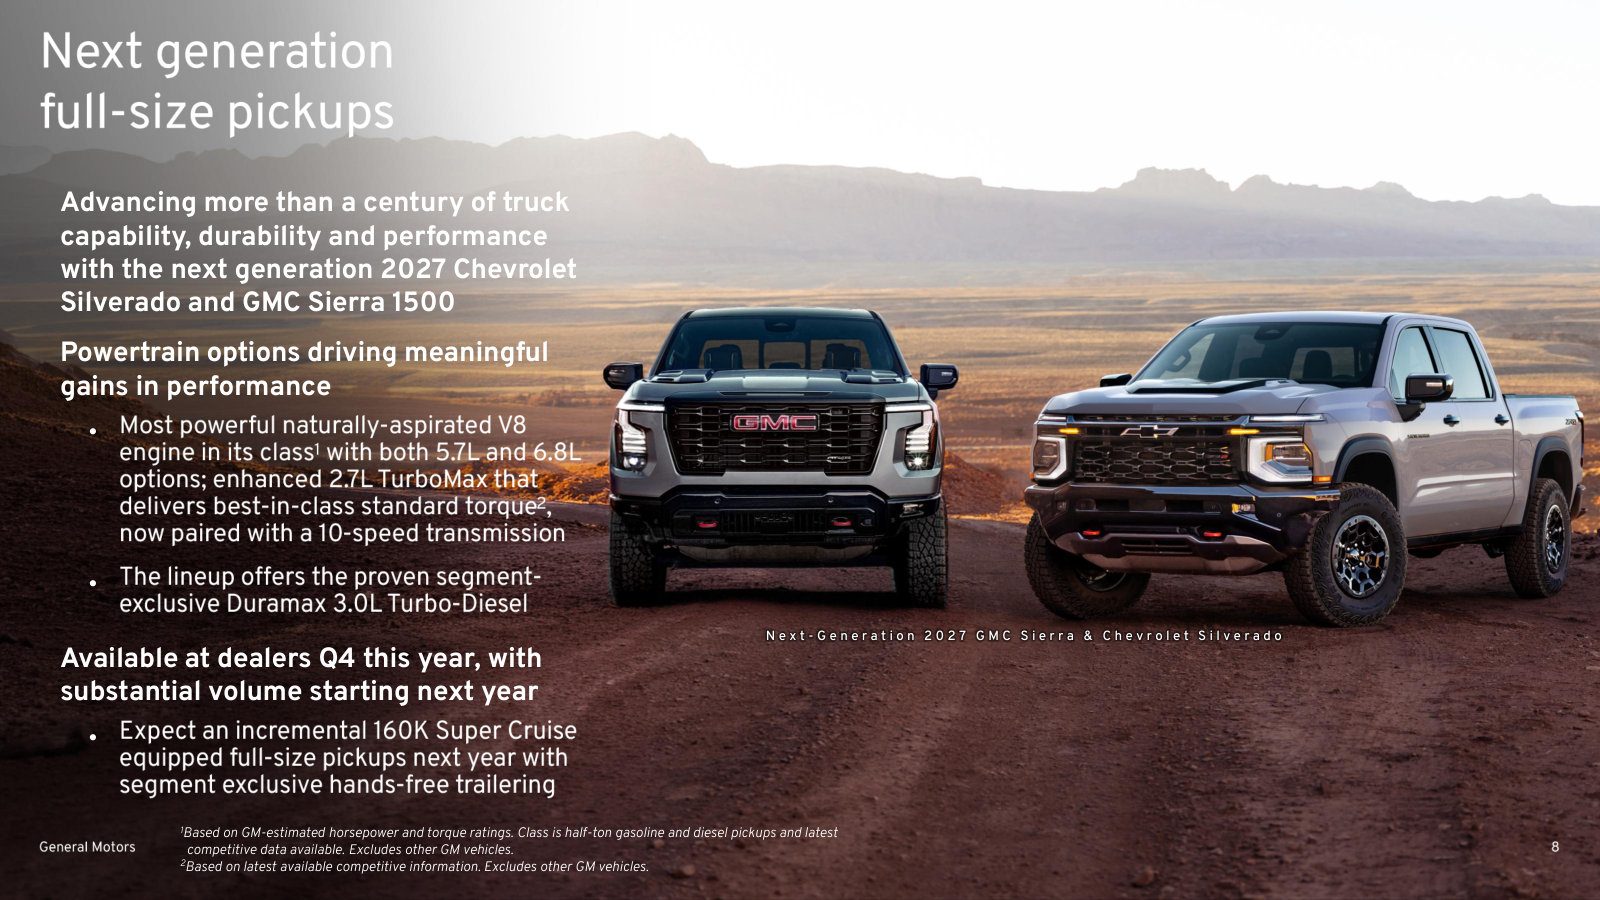
More from management
Q4 and Full-Year 2025 Earnings Presentation — FY2025 · 42 pages · Full-year 2025 results and the original 2026 guidance, including the $6.0B of Q4 EV-related charges. · Open →
Q4 and Full-Year 2024 Earnings Presentation — FY2024 · 48 pages · The 2024 peak - $14.9B EBIT-adj. before tariffs - and the 2025 guidance management set against it. · Open →
Investor Day 2024 - Mary Barra Keynote — 2024 · 21 pages · The CEO's investor day slides. Headline numbers over photographs, so the substance sits in the spoken remarks. · Open →
Q4 and Full-Year 2023 Earnings Presentation — FY2023 · 45 pages · How GM framed the EV ramp and its 2024 targets before both were cut back - useful for what changed. · Open →
Q3 2023 Earnings Presentation — Q3 2023 · 40 pages · The last deck presenting Cruise as a growth business, alongside the Ultium battery plans of that period. · Open →
General Motors Company's management answers for the business every quarter. These are the exchanges that explain it best — verbatim, from the call transcripts preserved in Sources. Each link opens the full transcript at that page in a new tab.
Q2 2026 Earnings Call — Q2 2026
The current state of the business in management's own framing: margins back in the target band, the truck launch, and the case that software, defense and insurance make GM less cyclical. · Open the full transcript →
Capital allocation stated as arithmetic: free cash flow funds buybacks, and the share count is down 35% in three years.
Paul Jacobson (EVP and CFO): On capital allocation, our strong first half-adjusted automotive free cash flow of $6.3 billion allowed us to continue executing against our share buyback program. In the second quarter, we made $2 billion in open market share repurchases, retiring approximately 25 million shares, which brings our first-half total to $2.8 billion repurchased and 36 million shares retired. This is nearly $1 billion more than the first half of last year, despite our EV restructuring efforts. We ended the second quarter with a diluted share count of 893 million, approximately 8% below where we ended the second quarter of 2025 and 35% below the second quarter of 2023. We have $3.5 billion remaining under our current repurchase authorization and expect to continue to consistently repurchase shares, supported by strong cash flow and our ending Q2 automotive cash balance of $19.7 billion.
p. 2 · Read in context →
How the warranty tailwind is built — cash outflows must plateau before accrual rates can come down.
Joe Spak (UBS); Paul Jacobson (EVP and CFO): Thank you. Second one is just on warranty, which seems like it's sort of coming in more favorable. Was wondering if you could maybe quantify how much warranty helped on a year-overyear basis in the quarter. Then if I recall, I think it's the third quarter where you typically have this reevaluation and potential reset of accrual rates. With respect to your full year commentary on warranty, I just want to make sure that really that's just sort of the better experience you've seen to date, and then there's maybe some potential for a reset to lower accruals later this year as well. Is that correct?
Paul Jacobson (Executive Vice President and Chief Financial Officer):
Yeah. As we said in the prepared remarks, Joe, it's about $500 million of benefit in the first half of the year. We increased from a billion-dollar year-over-year tailwind to a billion to a billion and a half. That's really as we're starting to look at what the September quarter Q3 adjustment will be, and as we go forward. We continue to see some good trends. It's not without some new challenges that pop up from time to time. I think the team overall is executing well. We think that this is part of the multi-year tailwind. Ideally, as we've talked about before, the monthly cash outflows plateau and then start to come down as we get through some of these historic quality spills, et cetera. That's where we can see benefit into 2027 and 2028 beyond what we're seeing in 2026.
p. 6 · Read in context →
The capital-discipline test applied to energy storage: partner for optionality rather than fund a plant in a commoditised business.
Paul Jacobson (EVP and CFO); question from Andrew Percoco (Morgan Stanley): Andrew, I think this has been obviously a topic across the industry. We've tried to approach it from, first of all, capital discipline as we look at the restructuring that we've done and so on. The idea, we turned down opportunities to put billions of capital into plants to tool up for what is already a highly competitive business based on potential extension of government credits and tax credits, et cetera. I think really what we're looking at here is how do we partner with technology that has synergies to the overall business, do it in a capital efficient manner. What we found in Peak Energy was the promise of a lot of technology, the ability to scale in something that we think is going to be cost effective, while at the same time we don't have to invest billions in capital to do it. We have a lot of optionality to participate as we choose. We're optimistic and in conversations with them, we think that there's a really good growth platform. We're going to be cautious rather than going all in into a hyper-competitive business.
p. 9 · Read in context →
Asked whether affordability is pushing buyers down-market, Barra says the long-predicted mix shift simply is not showing up.
Andrew Percoco (Morgan Stanley); Mary Barra (Chair and CEO): Then maybe my second question, just as it relates to, I know there's obviously a lot of attention on affordability. Doesn't seem to have really had an impact yet on demand for trucks. I know sometimes it takes a while for that to flow through. I'm just curious, as you think about your guidance for the remainder of the year, as obviously you made some comments about 2027, are you anticipating a mix shift more towards crossovers, understanding they're more profitable today than they maybe were two years ago? Just curious if you've made any underlying assumptions for that mix shift into maybe smaller, more fuel efficient vehicles in the back half of the year and into 2027. […] Well, Andrew, that's been predicted for several months now, and it's just not happening. We're seeing really strong full-size truck demand and full-size utility for that matter. We're building everything that we can sell. To your point, we're going to be guided by the consumer, and I mentioned how we've improved the profitability of our SUVs across the board. I think we're extremely well positioned from an affordability perspective to meet the customer where we are, but we're just not seeing it. I think something would have to happen for a long period of time before people would make potentially a different decision. We're seeing strength even though it's been predicted now for probably about three or four months.
p. 9 · Read in context →
Fleet reframed: no longer a dumping ground for excess capacity but a deliberately allocated, margin-neutral channel.
Mark Delaney (Goldman Sachs); Paul Jacobson (EVP and CFO): My other question was on fleet. It's been very strong, as you mentioned in the prepared remarks. Why does GM think the fleet business has been so strong, and what's your view on the ability to sustain that? Thank you.
Paul Jacobson (Executive Vice President and Chief Financial Officer):
I think the team's done a really good job here, Mark, it really goes to the quality of the portfolio and the services that we can offer across the board. When we look at the relations that we have with our fleet customers, and that's across the board, whether it's rental or it's government or it's commercial, I think those go a long way, and they really respond to the products that we have. I think the difference is, fleets historically, I think was an outlet for excess capacity. That's really changed today. We very consciously allocate between retail and fleet and where we can, but we don't sacrifice value when we're doing that. We're looking to balance the enterprise as a whole, rather than historically where we would just offer pretty significant discounts on the fleet side. That's not the way it's working anymore, and it really depends on those relationships.
p. 14 · Read in context →
Q1 2026 Earnings Call — Q1 2026
The clearest walk-through of how the OnStar/Super Cruise business is actually accounted for, plus the commodity-hedging and EV-charge cash mechanics behind the guidance. · Open the full transcript →
Why GM's autonomy bet is a product bet, not a fleet bet: one system spread across ICE and EV, brands and price points.
Mary Barra (Chair and CEO): We are doing something unique in the autonomous space, which is developing a system for personal vehicles that we can deploy on both ICE vehicles and EVs and scale across multiple brands and price points. We're stress testing it in the digital environment capable of simulating roughly 100 years of human driving every single day. We recently took the next step and began supervised on-road testing in California and Michigan. The way we're building this technology is a reflection of how seriously we're embracing AI across the enterprise. Today, nearly 90% of the code written by our autonomy team is generated by AI.
p. 2 · Read in context →
The EV restructuring as a cash schedule: $7.6bn of 2025 charges plus $1.1bn more, and how much of the cash portion is already out the door.
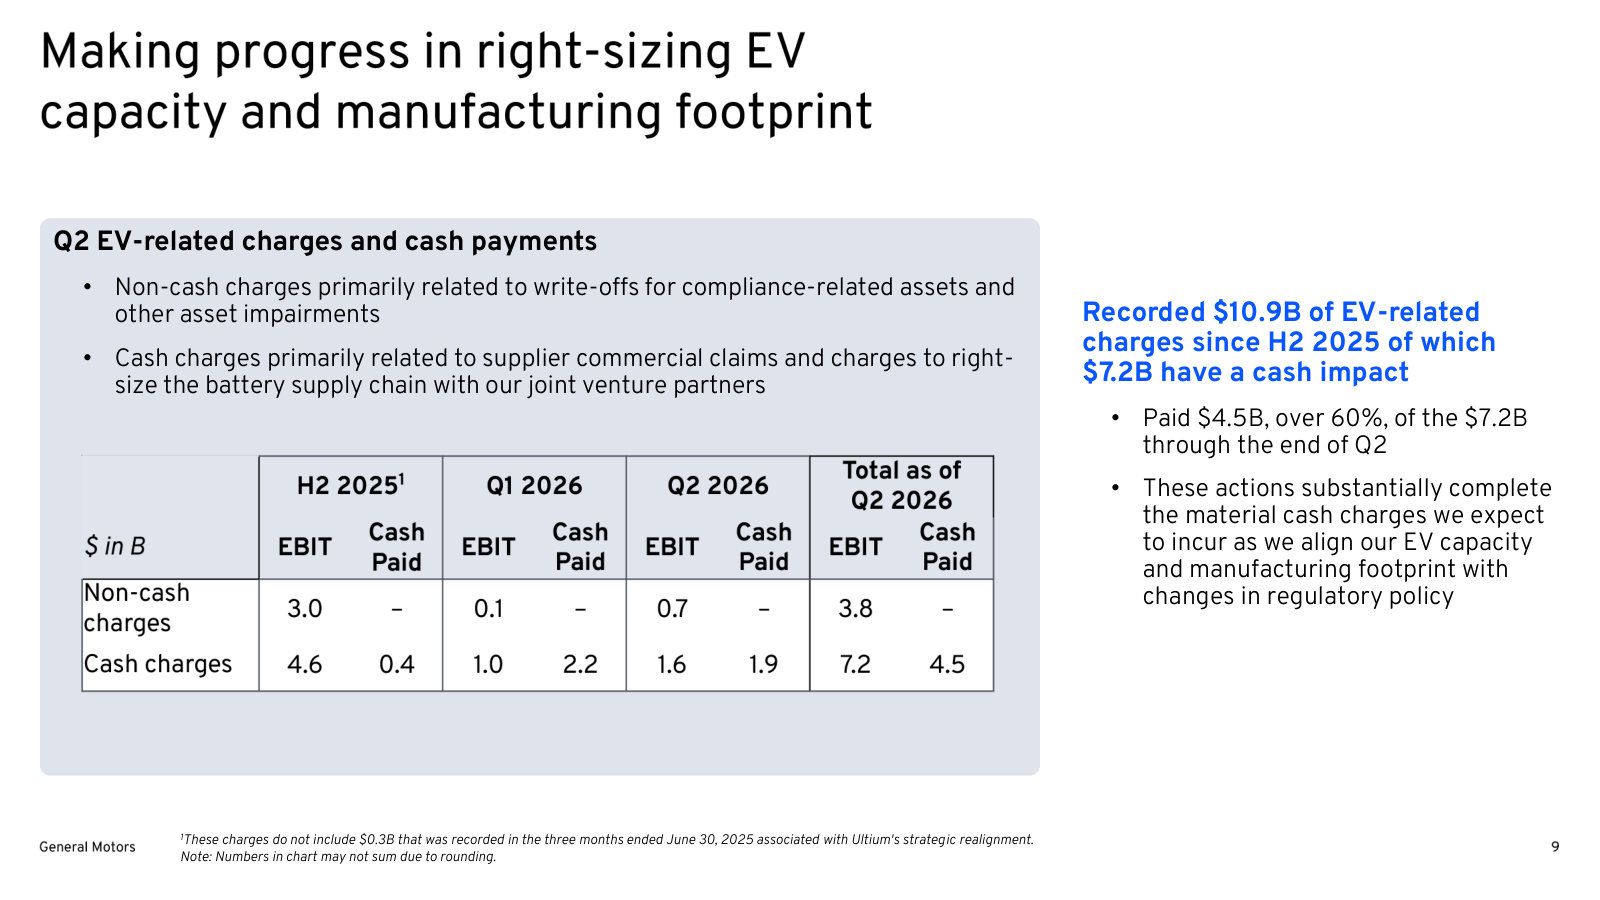
Paul Jacobson (EVP and CFO): In the second half of 2025, GM recorded a total of $7.6 billion in EV related charges. This breaks down into $4.6 billion of estimated cash charges and $3 billion in noncash impairments. In the first quarter, we took an additional $1.1 billion in EV charges, driven mainly by contract cancellations and supplier commercial claims. We expect about $1 billion of this will have a future cash impact. We're moving quickly to finalize claims. To date, we've already recorded around 90% of the expected total supplier commercial claim costs, and we anticipate reaching agreements in principle on most of the remainder during the second quarter. Separately, we continue to work expeditiously through rightsizing our battery supply chain with our joint venture partners. Of the total, $5.6 billion in EV-related cash charges recorded since the second half of 2025, $2.6 billion has been paid as of March 31. In April, we've already paid an additional $600 million, and we continue to expect most of the remaining cash flows to occur in 2026.
p. 3 · Read in context →
Pressed on the guidance raise, Jacobson concedes it is the tariff receivable, not an operating change, and no refund timing is assumed.
Joe Spak (UBS); Paul Jacobson (EVP and CFO): And one clarification on the tariff receivable: this is just the receivable for your overpayment, correct? You are not assuming in your guidance that you will avoid paying this in the back half or that the 122 replacements remain in place. You are not modeling a benefit from not paying it in the back half, correct? […] Yes. Let me cover the tariff question first. We took the direct tariff we paid last year that was subject to the Supreme Court decision and credited that back as a receivable. We haven't changed our free cash flow guidance because we don't know when the refunds will be received or how that window might work going forward. That's the only assumption we've made. Keep in mind most of our tariff burden comes from 232, so the EPA-related portion is relatively small versus our size. Because of that entry, we lowered the tariff guidance. We are not projecting any other changes to our tariff bill. When I said guidance down, I was referring to tariff bill guidance.
p. 6 · Read in context →
Commodity exposure explained: hedges plus steel contracts laddered in thirds, which damps moves in both directions.
Emmanuel Rosner (Wolfe Research); Paul Jacobson (EVP and CFO): That's very fair and great color. And I guess just as a follow-up on this then, in terms of input cost inflation and commodities, can you tell us what you have assumed in this updated guidance, which reflects that inflation costs have been increased by another $0.5 billion? What are you assuming for commodities in the back half, or how long they stay high as a base case scenario?
Paul Jacobson (Executive Vice President and Chief Financial Officer):
Yes, Emmanuel. What we've done is take the current curve net of our hedges. It's not entirely direct or linear because of, for example, our steel contracts. If you recall, roughly one third is spot, one third expires within a year, and the remaining third is over two years, and that mix has helped us. When prices go down we pay a little more, and when prices go up we pay a little less. We expect the current environment to persist through the year, and if the conflict ends and commodity and oil prices return to pre-conflict levels, we could potentially see upside.
p. 7 · Read in context →
The Super Cruise model contrasted with rivals: customers prepay three years, which covers the hardware, then ~40% renew.
Mark Delaney (Goldman Sachs); Paul Jacobson (EVP and CFO): My other question was on Super Cruise and the digital services. For the strong growth that GM has been seeing in Super Cruise and the willingness for consumers to subscribe after the prepaid subscriptions last, can you speak a bit more on the breadth of that consumer demand? And is it concentrated in the higher end parts of the portfolio like Cadillac or is GM seen consumer demand for those solutions more broadly?
Paul Jacobson (Executive Vice President and Chief Financial Officer):
So what I would say, Mark, is we're continuing to trend at about a 40% attachment rate after the subscription period, and we do it differently. Other competitors put the hardware on every vehicle and bear that cost; in our case, consumers who purchased Super Cruise prepaid for a three-year period, which covers the hardware cost. That creates deferred revenue tied to the vehicle, and then we have the subscription afterwards. We're starting to see an increase in the number of vehicles coming off that three-year prepaid period, and we're still holding attachment rates in the 40% range. We're very optimistic about what that means. When you look at ARPU, you have to take into account the scale advantage we have, especially as we grow into SDV 2.0 and expand it more broadly. Super Cruise is a strong leading indicator, and we're continuing to invest in delivering more value to customers to make it even more attractive in the future.
p. 7 · Read in context →
Where the software-like margin comes from — hardware expensed at the sale, revenue deferred over three years.
Michael Ward (Citigroup); Paul Jacobson (EVP and CFO): And then just going back to the digital services. I think you said that you expect margins to be in line with other software companies. When will we see those types of margins? I don't know if we're there yet now or not or if they're upfront costs you take. How does that cost/revenue curve look out over the next 2 to 3 years?
Paul Jacobson (Executive Vice President and Chief Financial Officer):
Yes. Mike, this gets a little technical, but I’ll summarize. When we sell a vehicle with Super Cruise, all the hardware costs are expensed immediately, while the revenue tied to that gets deferred over a three-year trial period. That deferred revenue comes in at a very high margin because the cost has already been recognized. For our other digital services and OnStar, some hardware costs are also expensed with the vehicle and there are ongoing service costs, so those margins aren’t quite as strong as the fully deferred case, but they’re still substantial. As we ramp up the deferred revenue base and it starts to amortize into the P&L at increasing rates, you’ll begin to see the impact. We discussed this at Investor Day a few years ago — it was expected to grow to a point that affects the company’s overall margins — and we’re starting to see that take hold. We also see a lot of potential from SDV 2.0 and future improvements to Super Cruise and eventually autonomy as we scale.
p. 9 · Read in context →
Q4 and Full Year 2025 Earnings Call — FY2025
The full-year reset: what the EV charges cost, what the capital-return record looks like after two years of buybacks, and the bridge to the 2026 guidance. · Open the full transcript →
The buyback record: $23bn returned and a third of the share count retired since late 2023, plus the valuation logic for continuing.
Paul Jacobson (EVP and CFO): Returning capital to shareholders remains a cornerstone of our capital strategy. In the fourth quarter, we executed $2.5 billion in open market share repurchases, retiring another 33 million shares and bringing total buybacks for the year to $6 billion. In 2025, we also distributed more than $500 million in dividends. Since announcing our accelerated share repurchase program in November 2023, we have returned $23 billion to shareholders through share repurchases. These actions have reduced our outstanding share count by more than 465 million shares or nearly 35%. Leaving approximately 930 million diluted shares at year-end 2025. Our strong execution and consistent capital returns have delivered substantial shareholder value with our stock price appreciating more than 170% since late November 2023. This performance reinforces our conviction that repurchasing GM stock at current valuation levels, which are back to historical norms but remain well below our peers represents one of the most compelling opportunities to continue to generate longterm shareholder value.
p. 3 · Read in context →
The EV write-down itemised: cash versus non-cash, and the point that the retail EV portfolio itself was not impaired.
Paul Jacobson (EVP and CFO): Turning now to our EV charges. During the third and fourth quarters, we reassessed our EV capacity and manufacturing footprint to better align with softer-than-expected consumer demand particularly in light of recent US government policy changes including the termination of certain consumer tax incentives. As a result, in the third quarter, we recorded charges totaling $1.6 billion including $1.2 billion of noncash impairment charges primarily related to transitioning our Orient assembly from EV to ICE production. The remaining $400 million consisted of cash charges associated with contractual cancellations and supplier settlements. […] The aggregate Q3 and Q4 charges totaled $7.6 billion of which $4.6 billion is expected to be settled in cash. In 2025, we made approximately $400 million in cash payments and expect to pay the majority of the remaining balance in 2026. […] It is important to note that besides BrightDrop, we have not impaired our existing retail portfolio of EVs. We are working to improve the profitability of these vehicles through new battery technologies, engineering improvements, and operational efficiencies, along with a more rational EV market. As consumer adoption of EVs increases, albeit at a slower pace than previously anticipated, we expect to achieve the necessary scale to deliver EVs profitably over time.
p. 4 · Read in context →
The hardest question on the call: does a fixed-cost base built for a far larger EV market still fit? The answer is what they chose to keep.
Dan Levy (Barclays); Mary Barra (Chair and CEO); Paul Jacobson (EVP and CFO): Great. Thank you. As a second question, I wanted to just ask about the dynamics of you product portfolio. And within that, first, maybe you could just address the fixed cost bas that you have. You still have all of your EV programs intact. You still have much of the battery capacity intact. This was set for a higher volume outlook you know, to what extent does this portfolio align with what's gonna likely be higher near-term ICE mix? And then maybe you could just address the potential to add hybrids into the portfolio. Just how much more do we have to see the portfolio and the fixed cost base shift to adjust to this new reality that we have. […] Yeah. Just to add to that, Dan, I think, you know, as we went through the restructuring, we were mindful of, you know, where is the excess capacity that we know we're not gonna need for a long time. Because we had built up for a very different regulatory environment Mary had said. But we're also cognizant of making sure that we preserve capacity to be able to pivot and rotate where we need to to get the cost savings. So particularly as it relates to battery capacity, you know, we've got enough to be able to transition to LMR and to LFP as those projects get underway over the next couple of years. So it really was trying to look at, you know, what is the right short-term decision, but also how do we balance that against long- term and where we know it's gonna go or we believe it's gonna go in the future. And as far as, you know, vehicle programs, remember, with the product cycle that the industry has, some of these decisions were made years ago. And we have to do our best to be able to pivot to where demand is gonna be. And I think if you look at this management team, and what it's accomplished over the last several years in the midst of a lot of uncertainty, I think, I think we've got what it takes to be able to respond and meet the consumer where they are a they continue to evolve.
p. 6 · Read in context →
GM Financial's industrial bank approval, and Sheffield declining to oversell it — deposits are complementary funding, worth basis points.
Michael Ward (Citigroup); Paul Jacobson (EVP and CFO); Susan Sheffield (President and CEO, GM Financial): And then on this announcement by the industrial bank, and I think FDIC approval the other day, that seems like a bigger deal than it just on the outset as it relates to the cost of capital for GM Financial. How much can you save from just a cost standpoint of capital?
Paul Jacobson (Executive Vice President and CFO):
Yeah. I'll start, and then I'll let Susan chime in as well. But, you know, this is really a great achievement and one that, you know, candidly probably should have been approved, a few years ago as we went through that. But, you know, the perseverance of the team to get that through provides yet another opportunity to drive capital in an efficient way for us. It'll take some time, but, Susan, I'll let you comment on anything you wanna add.
Susan Sheffield (President and CEO of GM Financial):
Yeah. Thanks, Paul, and thanks for the question. I'm very excited to have the conditional approval and get the industrial bank up and running. And as Paul said, this is going to be complementary to our funding platform, and it will allow us to offer depository products and another source of funding to help us bring down the cost of funds somewhat. They are highyield savings accounts and broker deposits. So as it gets up and running, again, complementary to our footprint, not gonna replace how we fund the business but will be complementary to it and allow us to bring down the cost of funds in the basis points over time and on our debt complex, you know, that's a meaningful move.
Michael Ward (Analyst): Meaningful. Like, 100 basis points? Is that the type of meaningful move you're talking about?
Susan Sheffield (President and CEO of GM Financial):
Probably not that much. It just depends on the rate environment. But it's gonna help us be more competitive.
p. 7 · Read in context →
When the listed puts and takes net to zero, the answer is that the real driver is margin recovery on cost GM absorbed in 2025.
Colin Langan (Wells Fargo); Paul Jacobson (EVP and CFO): Great. Thanks for taking my questions. If I look at the quantified puts and takes in the guidance, they kind of net out. So what is actually driving the expected increase? There's a slight increase in pricing. And then is the rest volume? Because I thought your commentary said ICE volume flat to slightly up. So what is the gap to kind of drive numbers up year over year?
Paul Jacobson (Executive Vice President and CFO):
Yes. So good morning, Colin. Thanks for the question. So we try to do a good job of laying out sort of the key headwinds and tailwinds. But, when we lay all of that out together, we actually see some upside coming through on that. Some of it'll be in our ability to lower our net tariff exposure. Some of it will be on the regulatory side, that we expect coming in. As well. And then some of it is, you know, gonna be continued work on driving EV profitability improvement. So we laid out what we see on some of the fixed cost relief. But as you know, we struggled this year with sort of step down after step down after step down in EV costs. That, you know, at the end of the day result in a lot of supplier claims that we've tried to sort of all bring together in the onetime step down. So when you look at it across the board, all of those results in what we believe is gonna be a pretty strong year-over-year improvement as we've highlighted. Colin Langan (Analyst):
So is that a cost improvement that you're implying that outside of what's listed in the slide?
Paul Jacobson (Executive Vice President and CFO):
I mean, ultimately, when you look at listings in the slide and what we've highlighted, it really comes down to a margin improvement on the vehicles, going forward because we absorbed so much cost in, in 2025. Between that warranty, all the tailwinds that we highlighted.
p. 11 · Read in context →
Warranty accounting from the ground up: monthly cash first, accruals follow, with the L87 V8 exposure named directly.
Emmanuel Rosner (Wolfe Research); Paul Jacobson (EVP and CFO): And then it was hoping to ask you about the warranty cost benefit of a billion dollars for this year. You just remind us the dynamics and then drivers of this? Obviously, you had know, pretty large warranty costs in 2025. But then I think, you know, recently, there was a reopening of the investigation into some of these V8 engines. So how much of it has already been essentially provisioned for? And what drives really, the confidence in this year's benefit?
## Paul Jacobson (Executive Vice President and CFO):
Yeah. So, all of this starts, Emmanuel, with what we see on the monthly cash and where we see the exposure. It's obviously a very complex set of calculations and analyses going forward across the vehicle universe, but it really begins with cash. And, we've seen that flattening, which is the first thing that needs to happen before you can ultimately come back down the curve on accruals because of the lagging effect, there. But when you look at the L87 and the V8 engines, we've seen really good progress with the fixes that the team has put out there with the oil change and some of the testing that we can do with dealerships. So, we believe that, that will mitigate and hopefully ultimately bring that down or so certainly not lead to any more increases going forward. So, you know, the team is hard at work across looking at every detailed cause of the warranty accrual. It's not just the big ones, but it's the small ones. We're looking at inflationary pressures that we've seen at the dealerships. And making sure that, that the dealers are charging fair prices to us for warranty, as they are for retail across the board. And, it's really an all-hands-on-deck, and we're starting to see some really early green shoots on some of that work that's been ongoing. And that's where we think it'll compound into warranty savings for us into '26 and hopefully beyond.
p. 13 · Read in context →
Q3 2025 Earnings Call — Q3 2025
The call where the EV thesis was rewritten in public: $1.6bn of charges, Orion turned back to ICE, BrightDrop killed, and the reasoning laid out step by step. · Open the full transcript →
The causal chain behind the write-down: capacity was built for an emissions regime that no longer exists.
Mary Barra (Chair and CEO): On the regulatory side, our portfolio and capacity plans over the last several years had been heavily influenced by steadily increasing stringency requirements for fuel economy and emissions. To meet these requirements, we were working aggressively to install and scale EV capacity. Now with an evolving regulatory framework and the end of the federal consumer incentives, it's clear that near-term EV adoption will be much lower than planned. This is resulting in higher variable costs as we expect to utilize less capacity across our EV plants and supply chain. All of this drove our decision to transition Orion Assembly from EV to ICE production and to sell our joint venture-owned cell plant in Michigan to LG Energy Solution. It's also why we recorded a $1.6 billion special item charge in the third quarter. $1.2 billion of the charge is for noncash impairments, most of which are related to the Orion transition, reductions in battery module assembly capacity, our decision to stop development of next-generation hydrogen fuel cells and the write-off of CAFE credits and associated liabilities. The remaining $0.4 billion is for cash charges related to supplier contract cancellation costs.
p. 1 · Read in context →
BrightDrop shut down and the reset justified on forward economics rather than on the sunk charge.
Mary Barra (Chair and CEO): However, we have decided to stop BrightDrop production at CAMI Assembly and assess the site for future opportunities. This is not a decision we made lightly because of the impact on our employees. However, the commercial electric van market has been developing much slower than expected, and changes to the regulatory framework and fleet incentives have made the business even more challenging. Our actions on BrightDrop and our ongoing work to reset our capacity will cause us to recognize a charge in the fourth quarter. By acting swiftly and decisively to address overcapacity, we expect to reduce EV losses in 2026 and beyond, making us much better positioned as demand stabilizes.
p. 2 · Read in context →
Where the onshored capacity actually goes — unmet Equinox and full-size SUV demand, not only tariff avoidance.
Itay Michaeli (TD Cowen); Mary Barra (Chair and CEO): I have a question regarding the changing emissions regulations. Can you discuss how these regulations might impact your ability to sell more ICE full-size pickups and SUVs in the coming years? When considering the Orion capacity, should we view it as an opportunity for incremental volume growth for GM, or is it mainly about mitigating tariffs?
Mary Barra (Chair and CEO):
Well, Itay, thanks. And as we look at shifting emission regulation, first, all the signals are that there are going to be fewer constraints. We've already seen some changes. We are waiting, and I think it will be early next year where it's finalized. But anticipating that we're going to be able to sell our internal combustion engine vehicles for longer, there are a couple of triggers. First, as we announced that the Equinox production will be installed into Fairfax, we have unmet demand from an Equinox perspective. So that's one upside. The second is around full-size trucks. And right now, our demand is supply-constrained from a full-size SUV perspective. So when Orion comes online, that's going to give us an opportunity to fully maximize really what is a franchise for GM with full-size utilities. And then with the truck, some of it will be shifting more to the U.S. from a tariff perspective, but also there could be global demand from a full-size truck perspective. So I think some of it is tariff mitigation, but there definitely is upside on some of the vehicles that have been constrained, and demand has exceeded what we've been able to build.
p. 5 · Read in context →
Tariff mitigation unpacked into its three real buckets, with the honest note that the footprint bucket does not pay until 2027.
Dan Levy (Barclays); Paul Jacobson (EVP and CFO): I wanted to just jump back on to the tariffs. And it looks like your mitigation is yielding stronger benefits. Maybe you could just unpack that a bit because it seems like in the market, pricing is a bit maxed out. We haven't seen the type of price increases we would have expected. So it looks like you're probably getting benefits off of the other two buckets you've discussed, which is cost and footprint. What's the runway on actions there and how this plays out in '26? And just to be clear, the current guidance for '25 tariffs does not include any easing of Korea tariffs. Is that correct?
## Paul Jacobson (Executive Vice President and CFO):
Yes, Dan, thanks for that question. So let me start with the first part. So if you go back to what we said at the beginning of the year, we really kind of highlighted three buckets: goto-market, footprint changes and fixed cost reductions. So go-to-market, we were pretty quick out of the gate to talk about changing our pricing forecast for the year, if you remember in the first quarter call. And that's held up, and we still expect to be up 0.5% to 1% on pricing year-over-year, somewhat helped by model '26, continued to help by the disciplined inventory and incentive approach that we've taken across the board. So that continues to bode pretty well for us. On the manufacturing footprint piece, we have some of those savings. If you recall, we announced an increase in the line rate in Fort Wayne, that's given us a little bit more utilization there that has flowed through. But the bulk of that is really going to be when the capital expenditures that we announced this year start to take effect in late '26, early '27 time frame. And then the third bucket is fixed cost. So I think we've done well to be disciplined there. We've seen a flattening of the curve pretty much, and I think we're maintaining that discipline. So all of those things we expect will hold into 2026 and the manufacturing footprint bucket can expand a little bit. And that's where we feel comfortable that we can get our net tariffs lower than what they are in 2025. And you're correct that there's no impact right now on any Korean changes in our guidance. We're still waiting for that to be finalized.
p. 6 · Read in context →
Autonomy strategy stated plainly: ~70% margins on Super Cruise today, Level 4 for personal vehicles, no robotaxi fleet.
Adam Jonas (Morgan Stanley); Mary Barra (Chair and CEO): Regarding autonomous vehicles, it seems that what was once perceived as nearly impossible is now being addressed. If you haven't been to Austin or San Francisco lately, you'll see significant progress. Your focus has shifted towards Advanced Driver Assistance Systems (ADAS), Super Cruise, and personal autonomy. I appreciate the disclosure of the $200 million in revenue; it would be helpful to know more about its profitability. You mentioned your commitment to achieving Level 4 autonomy, specifically for personal vehicles. I’m curious whether you are planning to introduce robotaxis or if the priority is to first focus on personal vehicles and assess the outcomes. Additionally, what milestones should we expect by 2026 in your journey towards autonomy?
Mary Barra (Chair and CEO):
Yes. First of all, I am really pleased with the performance from Super Cruise today and the fact that it continues to improve. We're achieving approximately 70% margins on that business. Our focus is on personal autonomy and Level 4. We are not involved in rideshare services at this time, and when considering the complexities of operating a robotaxi fleet, that is not currently our core business. We are concentrating on individual vehicles. Even with today's rideshare services, people still prefer to own a car for the freedom it provides to travel whenever and wherever they want. We believe this preference will remain for a long time. However, personal autonomy in these vehicles will be crucial. We will share more about our milestones next year, but I can assure you that our team is working diligently. The software team, in collaboration with Cruise resources and Sterling Anderson, who joined us from Aurora, places us in a strong position. Stay tuned for updates on the 2026 milestones. Additionally, we will share more at our GM Forward Media Day tomorrow. Thank you, Adam, and best of luck to you.
p. 11 · Read in context →
Why one large charge beat another year of trimming: repeated step-downs 'wreak havoc' on supplier and logistics cost.
Emmanuel Rosner (Wolfe Research); Paul Jacobson (EVP and CFO): I would like to explore further the strategies you have in place for continued progress in 2026, particularly concerning the losses in electric vehicles. Could you clarify some of the recent actions taken in Q3 and Q4, such as the write-downs of certain EV assets and adjustments to your capacity? Specifically, how much do these factors alone contribute to improving your structural costs for electric vehicles?
Paul Jacobson (Executive Vice President and CFO):
Emmanuel, I think if you look at this year, we talked about being able to improve our profitability with higher volume. And what we've seen is when we get into a situation where we have sequential step-downs in production capacity, it really wreaks havoc throughout the supply chain, logistics, supplier ramp-up costs, et cetera. So we found ourselves sort of chasing that downward. And what we really ultimately have realized is for now under the changing regulatory environment, we expect EV demand growth to slow pretty significantly from what it was going to be. And so we need to make sure that we rightsize the capacity footprint to be able to not have to absorb a lot of those fixed costs. So while it's unfortunate, I think it is a quick adjustment to the reality around us that we're facing, and we're pivoting to be able to do that. So the charges that we took in the quarter will help that a little bit. And as we've said, we're continuing to review this. We do expect there to be some additional charges in 4Q. We haven't fully sized that up. But as we do that work and ultimately finalize that in the quarter, I think we'll have a better view of how we can translate that to '26 and beyond.
p. 11 · Read in context →
Q2 2025 Earnings Call — Q2 2025
The tariff-shock quarter: $1.1bn of net tariff cost in one quarter against a $4–5bn annual exposure, and the sharpest analyst challenges to the EV plan. · Open the full transcript →
The structural answer to tariffs: $4bn of US plant investment adding 300,000 units and taking domestic output above 2 million.
Mary Barra (Chair and CEO): For example, the $4 billion of new investment in our US assembly plants will add 300,000 units of US capacity for high-margin light-duty pickups, full-size SUVs, and crossovers to help us greatly reduce our tariff exposure, satisfy unmet customer demand, and capture upside opportunities as we launch new models. The capacity begins coming online in just 18 months, after which we project building more than 2 million vehicles in the US each year as we scale.
p. 2 · Read in context →
The tariff bill quantified in the quarter it first bit, with the mitigation target and why offsets lag.
Paul Jacobson (EVP and CFO): EBIT adjusted was $3 billion for the quarter, inclusive of a net tariff impact of approximately $1.1 billion with minimal mitigation offsets. As we've previously mentioned, mitigation efforts will take time to yield results. Limiting their effect on the second quarter. However, we're still tracking to offset at least 30% of the $4 billion to $5 billion full-year 2025 tariff impact through strategic actions such as manufacturing adjustments, targeted cost initiatives, and consistent pricing.
p. 3 · Read in context →
Margin restated ex-tariff at ~9%, immediately followed by an unusually blunt admission on warranty.
Paul Jacobson (EVP and CFO): In North America, we delivered EBIT adjusted of $2.4 billion and EBIT adjusted margins of 6.1%. Excluding the impact of tariffs, our margin would have been approximately 9%, which underscores the fundamental strength of our business. On a comparative basis, this keeps us well within our pre-tariff margin target of 8 to 10%. In addition to the impact of tariffs, warranty expenses have also been the main factors behind the higher warranty expenses relate to L87 issues and higher warranty claims from software issues on some of our early EV launches. Let me be clear. We are not happy with our warranty trend and are facing these challenges head-on, with the top priority always being our customers. We provided extended warranties in some instances and taken other proactive steps to support those affected, including shifting some supply of our components to our aftersales group to decrease repair times.
p. 4 · Read in context →
With the tax credit gone, Levy asks whether the affordable EV can ever earn its keep; Barra commits without a date.
Dan Levy (Barclays); Mary Barra (Chair and CEO): that the tax credit is on its way out and there's changes in the regulatory schemes, I know we've been a broad lineup across price points, but the profitability has been challenged. And I think these changes indicate profitability is probably going to get a little trickier. So especially given you're losing some of the scale benefits, which was supposed to drive profit. So how do we look at you know, the depth or the breadth of your EV lineup going forward and the price points at which you're offering vehicles, when it seems like it's just gonna be much tougher to get profitability at the more lower price point? Is it that we just see higher price points, and that's the strategy? […] What we have been saying is that what we're investing going forward is largely focused on improving our EV profitability. The announcements we've made from a battery perspective, with LMR and LFP, some of the work that we're doing as we move forward to have a lighter architecture is more aerodynamic, that allows us to use a smaller battery. So we're very focused in this period of time to drive not just get to variable profit profitability but get profitability and then, you know, to continue to improve so we have appropriate and strong margins from our EVs as well. […] And there's a clear path to grow to get profitability on the affordable EV?
## Mary Barra (Chair and CEO):
Well, you know, that that is what we're working on from all aspects. And, definitely, the battery technology changes. And you know, as we grow with affordable, which is in the heart of the market, that gets us the scale benefits as well. So we are focused on each and every vehicle getting to profitability and we're not going to stop until they do.
p. 8 · Read in context →
Asked what tariffs do to earnings power beyond 2025, Jacobson separates the Korea line item from the structural self-help.
Ryan Brinkman (JPMorgan); Paul Jacobson (EVP and CFO): I wanted to ask on the impact of tariffs on your earnings power as we move beyond this year. Now earlier, you'd called out $4 to $5 billion of tariff impact over the course of 2Q through 4Q 2025. So annualizing to maybe $5.3 to $6.7 billion. The goal of mitigating at least 30% of the impact this year. But that was before the various investments in US manufacturing announced during the quarter. How should we think about these footprint actions impacting net tariff costs going forward? You know, what degree of tariff cost mitigation beyond the 30% target for this year do you think you might be able to accomplish after these investments come online in 18 months' time? Paul Jacobson (Executive Vice President and CFO):
Yeah. Good morning, Ryan. I'll take that one. Thanks for the question. You know, we have highlighted that up to $4 billion to $5 billion, about $2 billion of it is Korea. And as Mary mentioned in their comments and recent question that, you know, obviously, the trade deals with Mexico, Canada, and Korea are gonna be important. We're not speculating on what those are going to look like going forward, but, you know, there is a possibility, and I don't a likelihood, if you will, that that ultimately, a tariff rate gets set at a lower level, which would ultimately bring that impact down. As far as the other aspects of the tariffs, you know, we talked about the $4 billion which will bring us when all that is implemented, producing over 2 million vehicles here in the US. That will take care of part of a large part of the other remaining tariffs that are out there. We're still working through supply chain and other indirect tariffs, but we're not speculating on what it'll be. But I expect that it is likely lower than the current run rate of what you would see just as things shake out. Remember, we're only 90 days into this. As to the 30%, I mean, these are shifts in the general operation of the business that we don't necessarily think go away if tariffs are reduced. So, you know, I think we've got a longer-term plan to be able to mitigate a substantial part of this. You know, we're obviously looking for things to normalize around these trade deals that will get done. And we expect that'll happen. But, you know, it's too soon to extrapolate that as a run rate into the future.
p. 8 · Read in context →
More calls
Q1 2025 Earnings Call — Q1 2025 · 14 pages · Where the tariff exposure was first sized at $4–5 billion and 2025 guidance was cut to $10–12.5 billion EBIT-adjusted — the baseline every later tariff comment is measured against. · Open →
Q4 and Full Year 2024 Earnings Call — FY2024 · 13 pages · The pre-tariff peak: record $14.9bn EBIT-adjusted and $14bn free cash flow, the exit from robotaxi funding at Cruise worth ~$1bn a year, and the China restructuring plan. · Open →
Q3 2024 Earnings Call — Q3 2024 · 15 pages · Guidance raised to the top of the range on $900m of positive pricing, with the first signal that China restructuring charges were coming in Q4. · Open →
Q2 2024 Earnings Call — Q2 2024 · 15 pages · Record first-half revenue and the four drivers management credited for it — useful as the clean statement of the operating model before tariffs and the EV reset. · Open →
Q1 2024 Earnings Call — Q1 2024 · 15 pages · An early guidance raise plus the Cruise restart in Phoenix — the moment GM still expected to fund robotaxis and scale EVs on the original curve. · Open →
Q4 and Full Year 2023 Earnings Call — FY2023 · 13 pages · The post-strike reset: the $1.1bn full-year UAW cost, capital spending pulled back, and the decision to add plug-in hybrids to the North American plan. · Open →
Q3 2023 Earnings Call — Q3 2023 · 15 pages · Guidance withdrawn mid-UAW-strike, with Barra's direct case on labour cost and the original 2025 EV margin targets still on the table. · Open →
General Motors Company's annual reports contain management's most considered account of the business. These are the sections, passages and visual pages worth opening in the originals preserved in Sources.
General Motors Company — FY2025 Annual Report (Form 10-K) — FY2025
The edition that documents the reset: $7.9 billion of EV realignment charges, $3.1 billion of tariff cost, Cruise folded into GMNA. · Open the full document →
Item 1. Business — p. 5 · Read the full section →
The whole company in a few pages: two auto segments, a captive finance arm, and the ICE-versus-EV balance GM now leans on.
Risks related to our competition and strategy — p. 24 · Read the full section →
The two risks that define GM today: EV demand that did not arrive, and profit that still rests on full-size ICE trucks and SUVs.
Slower EV adoption already cost GMNA $7.9 billion of charges in 2025, and management flags more portfolio actions if it persists.
The success of our long-term EV strategy is dependent on consumer adoption of EVs. Consumer adoption of EVs has been slower than anticipated in light of recent U.S. Government policy changes, including the termination of certain consumer tax incentives for EV purchases. […] For example, in light of the recent U.S. Government policy changes, we have reassessed our EV capacity and manufacturing footprint and completed a strategic realignment to expected consumer demand, and have recorded charges of $1.6 and $6.0 billion in the three months ended September 30, 2025 and December 31, 2025. For the year ended December 31, 2025, we recorded total charges in GMNA of $7.9 billion. If industry-wide adoption rates continue to be slow, we may need to take additional portfolio actions to better match the consumer pace of EV adoption, such as not fully utilizing or reducing the capacity of our existing or future plants or reducing production hours or shifts, and we may become subject to claims by suppliers as a result of such actions.
p. 26 · Read in context →
Management states plainly that full-size ICE trucks and SUVs carry the margin and fund everything else.
Our near-term profitability is dependent upon the success of our current line of vehicles, particularly our full-size ICE SUVs and full-size ICE pickup trucks. While we offer a broad portfolio of cars, crossovers, SUVs, and trucks, along with a strategic portfolio of EVs, we currently recognize the highest profit margins on our full-size ICE SUVs and full-size ICE pickup trucks. As a result, our success is dependent upon our ability to sell higher margin vehicles in sufficient volumes. We are also using the cash generated by our current ICE vehicles to fund our growth strategy, including with respect to the continued development of next-generation ICE vehicles, EVs, autonomous and ADAS technologies, and software-enabled services. […] More stringent fuel economy regulations could also impact our ability to sell these vehicles or could result in additional costs associated with these vehicles, which could be material.
p. 26 · Read in context →
Risks related to our operations — p. 29 · Read the full section →
Tariffs and China moved GM’s 2025 numbers more than anything else, and both risks are written with figures rather than boilerplate.
GM concedes its mitigation actions will not fully offset tariffs in the near term.
Tariffs applicable to the automotive industry continue to evolve, including in the U.S., where the government has signaled tariff policy may shift in the future. Such tariffs could have a material adverse effect on our financial condition and results of operations. […] We cannot predict with complete precision the breadth of tariffs and related costs that will impact GM in the future. As a result, the ultimate impact of tariffs on our business could exceed our current estimates, which could have a material adverse effect on our financial condition, results of operations and cash flows, and our expected financial results. Our efforts to mitigate the impact of tariffs, including, but not limited to, making changes to our U.S. production plan and reducing or pausing certain imports, may not be successful, and we do not expect such actions to fully offset the impact of tariffs in the near term.
p. 31 · Read in context →
The China JV write-downs quantified, with more SGM restructuring charges expected in 2026.
Our business in China subjects us to unique operational, competitive, regulatory, and economic risks. […] Over the last several years, this intense competition and an increasingly challenging operating environment negatively impacted the profitability of our operations in China, our China JVs' ability to grow vehicle sales in China, and our ability to generate sustainable equity income from our China JVs. As a result of certain restructuring actions previously announced in December 2024, we recorded an other-than-temporary impairment of our equity interests of $2.1 billion and additional equity losses of $2.0 billion in the year ended December 31, 2024, and we recorded charges of $0.6 billion in the year ended December 31, 2025. We expect SAIC General Motors Corp., Ltd. (SGM) will likely incur additional restructuring charges in 2026.
p. 31 · Read in context →
Item 7. Management's Discussion and Analysis of Financial Condition and Results of Operations — p. 51 · Read the full section →
The Overview sizes the year’s two shocks — tariffs and the EV realignment — then sets 2026 guidance against them.
Tariffs cost $3.1 billion of EBIT-adjusted in 2025, with $3.0-4.0 billion guided for 2026.
Over the course of 2025, the U.S. and other governments implemented new tariffs relevant to GM and its suppliers, including tariffs on vehicles and parts imported into the U.S. […] In 2025, impacts to earnings before interest and taxes (EBIT)-adjusted from tariffs were $3.1 billion. Based on the current tariff environment, we estimate that impacts to EBIT-adjusted could range from $3.0 billion to $4.0 billion for the year ending December 31, 2026. […] Because of these recent U.S. Government policy changes, including the termination of consumer tax incentives for EV purchases and the reduction in stringency of emissions regulations, industry-wide consumer demand for EVs in North America began to slow in 2025.
p. 51 · Read in context →
Automotive Financing - GM Financial Summary and Outlook — p. 55 · Read the full section →
Almost half of GM Financial’s revenue is lease income, which makes used-vehicle residual values a direct GM earnings exposure.
Penetration, revenue mix and the residual-value exposure that sits behind 46% of GM Financial revenue.
GM Financial's penetration of our retail sales in the U.S. was 33% in the year ended December 31, 2025 and 39% in the corresponding period in 2024. […] In the year ended December 31, 2025, GM Financial's revenue consisted of leased vehicle income of 46%, retail finance charge income of 41%, and commercial finance charge income of 7%. […] Through its leasing program GM Financial is exposed to residual values, which are heavily dependent on used vehicle prices. Gains on terminations of leased vehicles of $0.6 billion and $0.8 billion were included in GM Financial interest, operating, and other expenses in the years ended December 31, 2025 and 2024.
p. 55 · Read in context →
Consolidated Results — p. 55 · Read the full section →
The passage that reconciles the $8.1 billion cost increase to its causes — EV realignment, tariffs, warranty — line by line.
Management's own bridge for the year's cost increase, from the EV realignment down to Cruise wind-down savings.
In the year ended December 31, 2025, increased Cost was primarily due to: (1) charges of $7.7 billion due to our EV strategic realignment; (2) increased material and freight costs of $3.3 billion, including $3.1 billion due to tariffs; (3) increased warranty-related costs and campaigns of $1.3 billion; (4) unfavorable net realizable value inventory adjustments, primarily EV-related, of $0.3 billion in the year ended December 31, 2025 compared to similar favorable inventory adjustments of $0.5 billion in the year ended December 31, 2024; (5) charges of $0.5 billion due to legal matters for our former OnStar Smart Driver program; and (6) increased manufacturing costs of $0.5 billion; partially offset by (7) the reduction of charges related to Cruise restructuring of $1.1 billion; and (8) decreased engineering costs of $0.9 billion, driven primarily by the wind down of Cruise robotaxi operations.
p. 56 · Read in context →
GM North America — p. 57 · Read the full section →
GMNA is 83% of revenue; here are the volume/mix/price/cost bridge and the truck-versus-car variable-profit spread.
The variable-profit spread — trucks at ~160% of portfolio average, crossovers at ~40% — that makes mix decisive.
GMNA EBIT-Adjusted The most significant factors that influence profitability are industry volume and market share. While not as significant as industry volume and market share, another factor affecting profitability is the relative mix of vehicles sold. Trucks, crossovers, and cars sold currently have a variable profit of approximately 160%, 40%, and 60% of our GMNA portfolio on a weightedaverage basis.
p. 59 · Read in context →
Critical Accounting Estimates — p. 69 · Read the full section →
Warranty/recall accruals and sales incentives set GM’s reported revenue and cost, and both carry disclosed sensitivities.
Incentives are booked as a revenue reduction at the time of sale on estimated take-up, not on cash paid.
Sales Incentives The estimated effect of sales incentives offered to dealers and end customers is recorded as a reduction of Automotive net sales and revenue at the time of sale. […] Significant factors used in estimating the cost of incentives include type of program, forecasted sales volume, product mix, and the rate of customer acceptance of incentive programs, all of which are estimated based on historical experience and assumptions concerning future customer behavior and market conditions. A change in any of these factors affecting the estimate could have a significant effect on recorded sales incentives. A 10% increase in the cost of incentives would increase the sales incentive liability by approximately $0.3 billion.
p. 69 · Read in context →
General Motors Company — FY2022 Annual Report (Form 10-K) — FY2022
Included for the strategy contrast: peak EV and Cruise ambition, stated in the same sections FY2025 now uses to walk it back. · Open the full document →
Item 1. Business — p. 5 · Read the full section →
Read against FY2025, this is the commitment GM later unwound — EV capacity targets and a dedicated Ultium platform.
The 2022 target: one million EVs of North American capacity and more than two million globally by the end of 2025.
Our vision for the future is a world with zero crashes, zero emissions and zero congestion, which guides our growth-focused strategy to invest in electric vehicles (EVs) and autonomous vehicles (AVs), software-enabled services and subscriptions and new business opportunities, while strengthening our market position in profitable internal combustion engine (ICE) vehicles, such as trucks and sport utility vehicles (SUVs). […] Electric Vehicles We plan to rapidly scale our capacity to build one million EVs in North America and more than two million EVs globally by the end of 2025. A key element in our EV strategy is Ultium, our dedicated electric vehicle propulsion architecture.
p. 5 · Read in context →
Environmental and Regulatory Matters — p. 19 · Read the full section →
The explicit all-electric pledge that the FY2025 filing replaces with a portfolio hedged between ICE and EVs.
The 2035 tailpipe-emissions pledge, stated as company policy three years before the EV capacity realignment.
We plan to be carbon neutral by 2040 in our global products and operations, supported by a commitment to science-based targets. In addition, the Company envisions an all-electric future and plans to eliminate tailpipe emissions from new U.S. light-duty vehicles by 2035.
p. 23 · Read in context →
More annual reports
General Motors Company — FY2024 Annual Report (Form 10-K) — FY2024 · 180 pages · The last edition before the EV realignment; records the $4.0 billion China JV charges and the decision to stop funding Cruise robotaxis. · Open →
General Motors Company — FY2023 Annual Report (Form 10-K) — FY2023 · 181 pages · Covers the UAW strike year and the Cruise operational pause, with Cruise still reported as a separate segment. · Open →
General Motors Company — FY2021 Annual Report (Form 10-K) — FY2021 · 166 pages · The semiconductor-shortage year, and the filing that first commits to "an all-electric future" and more than $35.0 billion of EV/AV spend. · Open →
Source: S&P Capital IQ consensus via Xpressfeed · Generated 2026-07-29.
FY2028 EPS consensus up 8% in 180 days while revenue estimates barely move
FY2027 shows the same pattern, EPS up 7% over 180 days against revenue down 0.1%. Both years' revenue estimates sit below where they were 30 days ago, so none of the EPS upgrade is coming from a bigger top line.
Currency: USD · Scale: money in millions, absolute · Point-in-time consensus; Δ90d is Now versus 90d.
| Metric | FY | 180d | 90d | 30d | Now | Δ90d |
|---|---|---|---|---|---|---|
| EPS (normalized) | FY2027 | $13.64 | $14.02 | $14.08 | $14.59 | +4.0% |
| EPS (normalized) | FY2028 | $14.39 | $14.67 | $14.76 | $15.57 | +6.1% |
| Revenue | FY2027 | $190.52bn | $191.59bn | $191.33bn | $190.32bn | -0.7% |
| Revenue | FY2028 | $192.87bn | $194.05bn | $194.11bn | $194.00bn | -0.0% |
Normalized EPS has beaten consensus eight quarters running, five times by double digits
Current sequences by metric: Revenue: 2 consecutive beats; EPS (normalized): 8 consecutive beats.
Currency: USD · Scale: money in millions, absolute · Consensus is captured before each actual first became effective.
| Quarter | Metric | Consensus | Actual | Surprise | Outcome |
|---|---|---|---|---|---|
| Q2 FY2026 | Revenue | $47.09bn | $48.03bn | +2.0% | Beat |
| Q2 FY2026 | EPS (normalized) | $3.18 | $3.57 | +12.1% | Beat |
| Q1 FY2026 | Revenue | $43.55bn | $43.62bn | +0.2% | Beat |
| Q1 FY2026 | EPS (normalized) | $2.62 | $3.70 | +41.3% | Beat |
| Q4 FY2025 | Revenue | $46.04bn | $45.29bn | -1.6% | Miss |
| Q4 FY2025 | EPS (normalized) | $2.26 | $2.51 | +11.1% | Beat |
| Q3 FY2025 | Revenue | $45.33bn | $48.59bn | +7.2% | Beat |
| Q3 FY2025 | EPS (normalized) | $2.32 | $2.80 | +20.5% | Beat |
| Q2 FY2025 | Revenue | $46.31bn | $47.12bn | +1.8% | Beat |
| Q2 FY2025 | EPS (normalized) | $2.48 | $2.53 | +2.1% | Beat |
| Q1 FY2025 | Revenue | $43.41bn | $44.02bn | +1.4% | Beat |
| Q1 FY2025 | EPS (normalized) | $2.67 | $2.78 | +4.3% | Beat |
| Q4 FY2024 | Revenue | $43.57bn | $47.70bn | +9.5% | Beat |
| Q4 FY2024 | EPS (normalized) | $1.84 | $1.92 | +4.3% | Beat |
| Q3 FY2024 | Revenue | $44.35bn | $48.76bn | +9.9% | Beat |
| Q3 FY2024 | EPS (normalized) | $2.39 | $2.96 | +23.8% | Beat |
The beat streak is a normalized-EPS story; the GAAP line keeps landing short
FY2025 normalized EPS came in at $10.60 while GAAP EPS printed $3.27. Quarterly GAAP EPS has repeatedly undershot its own consensus mean — negative $3.60 against $1.75 in Q4 2025, $1.35 against $2.03 in Q3 2025, and $1.41 against $2.73 in Q2 2026. Consensus FY2026 GAAP EPS of $9.43 sits well below the $13.28 normalized line, and only six analysts publish it against 24 on the normalized number.
Consensus revenue grows about 2% a year to FY2028 while normalized EPS climbs from $13.28 to $15.57
Gross margin is modelled to widen every year, from 15.9% to 19.3%. Normalized net income rises just 1.3% between FY2027 and FY2028 while normalized EPS rises 6.7%, which implies a smaller share count. Coverage thins as the years extend, from 19 analysts on FY2026 revenue to 13 on FY2028.
Currency: USD · Scale: money in millions, absolute · YoY uses the prior fiscal year from the feed; analyst count and range use the first displayed period.
| Metric | FY2026E | FY2027E | FY2028E | YoY | Analysts | Low / high |
|---|---|---|---|---|---|---|
| Revenue | $185.72bn | $190.32bn | $194.00bn | +0.4% | 19 | $183.02bn / $189.24bn |
| Gross margin | 15.9% | 18.0% | 19.3% | +5.3pt | — | — |
| EBITDA | $22.96bn | $23.76bn | $24.24bn | -7.2% | 12 | $18.42bn / $27.38bn |
| Net income (normalized) | $11.91bn | $12.34bn | $12.50bn | +18.7% | — | — |
| EPS (normalized) | $13.28 | $14.59 | $15.57 | +25.3% | 24 | $11.85 / $14.12 |
| EPS (GAAP) | $9.43 | $13.92 | $15.65 | +188.3% | 6 | $6.25 / $10.63 |
FY2028 EPS estimates span $10.55 to $17.80 across 13 analysts
FY2027 revenue estimates run from $183.5bn to $204.0bn on 20 analysts, a $20bn gap on a top line consensus expects to be close to flat. GAAP net income is far wider in relative terms, $8.8bn to $15.8bn on 10 estimates.
Currency: USD · Scale: money in millions, absolute · Spread/mean is absolute high-low divided by absolute mean.
| Metric | Period | Mean | Low–high | Spread/mean | Analysts |
|---|---|---|---|---|---|
| EPS (normalized) | FY2028E | $15.57 | $10.55–$17.80 | 46.6% | 13 |
| Net income (GAAP) | FY2027E | $11.94bn | $8.78bn–$15.84bn | 59.1% | 10 |
| Revenue | FY2027E | $190.32bn | $183.48bn–$203.95bn | 10.8% | 20 |
| EBITDA | FY2027E | $23.76bn | $19.69bn–$28.10bn | 35.4% | 12 |
FY2029 is not a consensus — one to three analysts per line
Three analysts carry FY2029 revenue and normalized EPS; one carries FY2029 EBITDA and GAAP EPS. The FY2029 normalized EPS mean of $12.14 sits below the FY2028 mean of $15.57, but the two are not comparable — different analysts, different sample size.
Visible Alpha broker models via S&P Xpressfeed · 17 brokers · 542 line items · freshest revision 2026-07-26.
Broker models frame GM as a margin-repair story rather than a growth story: total revenue is essentially flat in FY-2026 against the FY-2025 base, yet operating margin steps from 6.7% to 8.2% as a roughly $3.95bn North America cost drag reverses. From FY-2027 the modeled margin flatlines just above 8.3%, and the pricing tailwind that carried the prior two years is walked down to about zero by FY-2028. Every profit pool outside North America — International, GM Financial and Corporate — is modeled flat to lower. Incremental earnings growth therefore leans on a delayed volume recovery and a shrinking share count.
FY-2026's margin step-up is a cost reversal, not price — and the price line decays to zero by FY-2028
| Line | FY-2025A | FY-2026E | FY-2027E | FY-2028E | YoY | Brokers |
|---|---|---|---|---|---|---|
| Prior-year base | — | — | — | — | — | — |
| Operating income/(loss) - North America Prior period | $14.53bn | $10.45bn | $12.89bn | $13.67bn | -28.1% | 14 |
| Walk | — | — | — | — | — | — |
| Operating income/(loss) - North America - Volume Impact | $-1.34bn | $-315.95m | $618.62m | $593.38m | +76.4% | 8 |
| Operating income/(loss) - North America - Mix impact | $-117.43m | $741.13m | $349.91m | $44.81m | +731.1% | 8 |
| Operating income/(loss) - North America - Price Impact | $1.05bn | $856.75m | $352.33m | $-46.81m | -18.5% | 8 |
| Operating income/(loss) - North America - Cost impact | $-3.95bn | $909.97m | $-179.38m | $-101.43m | +123.0% | 7 |
| Operating income/(loss) - North America - Other Impact | $931.83m | $514.01m | $-48.00m | $59.46m | -44.8% | 7 |
| Result | — | — | — | — | — | — |
| Operating income - GM North America - Operating | $10.32bn | $12.89bn | $13.73bn | $13.97bn | +24.8% | 14 |
North America is the only profit pool the street grows; International, GM Financial and Corporate all fade
| Line | FY-2025A | FY-2026E | FY-2027E | FY-2028E | YoY | Brokers |
|---|---|---|---|---|---|---|
| North America | — | — | — | — | — | — |
| Revenue - GM North America | $155.34bn | $154.46bn | $158.65bn | $160.67bn | -0.6% | 14 |
| Operating income - GM North America - Operating | $10.32bn | $12.89bn | $13.73bn | $13.97bn | +24.8% | 14 |
| International | — | — | — | — | — | — |
| Revenue - GM International | $13.45bn | $13.96bn | $14.11bn | $14.20bn | +3.8% | 14 |
| Operating income - GM International Operations - Operating | $695.56m | $680.21m | $607.88m | $628.27m | -2.2% | 13 |
| GM Financial | — | — | — | — | — | — |
| Revenue - GM Financial | $16.98bn | $17.28bn | $17.49bn | $17.65bn | +1.8% | 15 |
| Operating income/(loss) - GM Financial - Operating | $2.90bn | $2.69bn | $2.73bn | $2.73bn | -7.3% | 14 |
| Corporate | — | — | — | — | — | — |
| Operating income-Corporate and Eliminations | $-918.60m | $-1.09bn | $-1.15bn | $-1.22bn | -18.5% | 14 |
| Group | — | — | — | — | — | — |
| Operating income/(loss) - Operating | $12.75bn | $15.14bn | $15.69bn | $15.83bn | +18.7% | 16 |
| Operating margin(%) | 6.7% | 8.2% | 8.3% | 8.4% | +1.5pt | 16 |
Units, not price: worldwide wholesales only clear the FY-2025 level in FY-2027, and China JV volume never does
| Line | FY-2025A | FY-2026E | FY-2027E | FY-2028E | YoY | Brokers |
|---|---|---|---|---|---|---|
| Units | — | — | — | — | — | — |
| Wholesale vehicle sales-Worldwide(K#) | 3.84m Number | 3.81m Number | 3.89m Number | 3.94m Number | -0.7% | 12 |
| Wholesale vehicle sales - GM North America(K#) | 3.33m Number | 3.27m Number | 3.35m Number | 3.38m Number | -1.7% | 12 |
| Wholesale vehicle sales - GM International(K#) | 504,935 Number | 536,499 Number | 538,394 Number | 543,581 Number | +6.3% | 11 |
| Wholesale vehicle sales - China JV(K#) | 2.04m Number | 1.85m Number | 1.86m Number | 1.91m Number | -9.3% | 9 |
| Wholesales vehicle sales - Including JV(K#) | 5.85m Number | 5.64m Number | 5.71m Number | 5.74m Number | -3.5% | 11 |
| Revenue per unit | — | — | — | — | — | — |
| Avg rev / unit($) | $44,014 | $44,274 | $44,491 | $44,482 | +0.6% | 12 |
| Avg rev / unit - GM North America($) | $46,611 | $47,182 | $47,390 | $47,379 | +1.2% | 12 |
| Avg rev / unit - GM International($) | $26,521 | $26,113 | $26,308 | $26,317 | -1.5% | 12 |
The near term is agreed; the split is about FY-2028 durability, where operating EPS spans $10.55 to $17.69
| Line | Period | Median | Q1–Q3 | Min–max | Brokers |
|---|---|---|---|---|---|
| EPS Diluted - Operating($) | FY-2028E | $16.49 | $15.25–$17.00 | $10.55–$17.69 | 9 |
| Operating income - GM North America - Operating | FY-2028E | $14.27bn | $13.65bn–$14.99bn | $10.16bn–$15.87bn | 8 |
| Shares - Diluted(M#) | FY-2028E | 824.03m Number | 801.38m Number–887.74m Number | 736.69m Number–928.00m Number | 10 |
| Operating income - GM International Operations - Operating | FY-2027E | $663.42m | $548.49m–$732.68m | $114.17m–$882.32m | 12 |
| Free cash flow - Automotives | FY-2026E | $6.01bn | $4.07bn–$6.06bn | $3.90bn–$6.85bn | 5 |
The FY-2026 cash dip is capex, not earnings: Automotive FCF drops to $5.4bn, then recovers near $10bn
| Line | FY-2025A | FY-2026E | FY-2027E | FY-2028E | YoY | Brokers |
|---|---|---|---|---|---|---|
| Cash generation | — | — | — | — | — | — |
| Net cash flows provided by/(used in) operating activities - Automotive | $20.01bn | $16.19bn | $21.35bn | $21.29bn | -19.1% | 9 |
| Capital additions - Automotives | $9.99bn | $10.53bn | $11.08bn | $11.06bn | +5.4% | 8 |
| Free cash flow - Automotives | $9.09bn | $5.38bn | $9.99bn | $10.25bn | -40.8% | 6 |
| Per share | — | — | — | — | — | — |
| Shares - Diluted(M#) | 970.36m Number | 907.10m Number | 870.78m Number | 833.53m Number | -6.5% | 16 |
| EPS Diluted - Operating($) | $10.41 | $13.44 | $14.65 | $15.79 | +29.1% | 15 |
| Dividend per share($) | $0.58 | $0.88 | $0.88 | $0.64 | +53.1% | 11 |
The differentiated lines are thin: the segment walk, cash and EV rows carry far fewer brokers than the P&L
Headline revenue and operating income carry 13-16 brokers through FY-2027, but the segment walk lines carry 4-8 and Automotive free cash flow 4-6. The Cruise lines have not been revised since 2025, and the EV unit and IRA-credit lines are single-broker models — one analyst's view, not consensus. FY-2028 coverage thins to 8-10 brokers on most lines.
Headline P&L consensus, momentum and beat/miss live in the CapIQ tab.
Source: S&P Capital IQ transcripts via Xpressfeed · latest indexed call 2026-07-21 · generated 2026-07-29.
Latest call digest
General Motors Company, Q2 2026 Earnings Call, Jul 21, 2026 · 2026-07-21T12:30:00
Q2 2026 earnings call — July 21, 2026. GM raised full-year 2026 guidance for the second time this year: EBIT adjusted to $14 billion to $16 billion, EPS diluted adjusted to $12 to $14, and adjusted automotive free cash flow to $9.5 billion to $11.5 billion. North America EBIT-adjusted margin was 8.6%, up 2.5 points year-over-year, which Jacobson framed as solidly back inside the 8% to 10% target the company has been chasing since tariffs landed. First-half revenue was $92 billion with $8.2 billion of EBIT adjusted.
Prepared remarks were mostly forward-looking rather than about the quarter. Barra spent her section on growth adjacencies — GM Defense, GM Insurance, Super Cruise proliferation onto the new light-duty pickups — and on the December launch of the next-generation Silverado and Sierra. Jacobson closed the EV restructuring story: $2.3 billion of incremental charges in the quarter, $10.9 billion recorded since the second half of 2025, of which roughly $7.2 billion is cash and $4.5 billion has been paid, and he described the material cash charges as substantially complete. He also previewed 2027 as a year of higher revenue, margins, EBIT and free cash flow.
The Q&A did not follow the prepared script. No one asked about the $2.3 billion of EV charges, China drew no dedicated question, and GM Defense and GM Insurance went unexamined despite the space Barra gave them. Analysts pressed instead on three things: whether the new truck can actually carry price, how Super Cruise economics change as it becomes standard content, and what the 2027 bridge looks like once you allow for headwinds. Levy (Barclays) opened the gap directly — the disclosed positives add up to more than the raise — and Jacobson answered by reframing the raise as banking first-half outperformance rather than a better cost outlook, stressing that commodity guidance had not improved. Rosner (Wolfe) made the sharpest point of the call: every 2027 driver management named was a tailwind. Jacobson conceded inflationary pressure without sizing it.
Guidance actually stated on the call: full-year North America pricing up around 0.5%; EV losses to improve $1 billion to $1.5 billion; warranty a $1 billion to $1.5 billion improvement, raised from $1 billion; emissions-related regulatory savings of $500 million to $750 million; gross tariff costs of $2.5 billion to $3.5 billion, largely flat year-over-year; commodity, logistics and DRAM inflation a $1.5 billion to $2 billion headwind; and $1 billion to $1.5 billion of onshoring, supply chain and software spend. Jacobson also flagged a fourth quarter weaker than normal seasonality, with a roughly 35,000-unit year-over-year volume headwind from the truck changeover.
Participant coverage from the latest call.
| Group | Participants | Count |
|---|---|---|
| Management | Operator; Ashish Kohli — Vice President of Investor Relations, General Motors Company; Mary Barra — Chairman & CEO, General Motors Company; Paul Jacobson — Executive VP & CFO, General Motors Company | 4 |
| Analysts | Joseph Spak — Analyst, UBS Investment Bank, Research Division; Dan Levy — Senior Analyst, Barclays Bank PLC, Research Division; Andrew Percoco — Head of North America Autos and Shared Mobility Research & Equity Analyst, Morgan Stanley, Research Division; Itay Michaeli — Senior Analyst, TD Cowen, Research Division; Michael Ward — Managing Director, Citigroup Inc., Research Division; Emmanuel Rosner — Managing Director of Research & Senior Research Analyst, Wolfe Research, LLC; Gautam Narayan — Assistant Vice President, RBC Capital Markets, Research Division; Mark Delaney — Equity Analyst, Goldman Sachs Group, Inc., Research Division; Rajat Gupta — Research Analyst, JPMorgan Chase & Co, Research Division | 9 |
Curated latest-call exchanges; one row per analyst topic.
| Analyst | Firm | Topic | What changed in Q&A |
|---|---|---|---|
| Dan Levy | Barclays Bank PLC, Research Division | Size of the guidance raise versus the disclosed positives | Levy said better pricing, warranty, wholesales and commodities add up to more than the raise, and asked what offsets them. Jacobson pushed back on the premise, said GM is not projecting lower second-half commodity prices, and characterized the raise as banking first-half outperformance on the assumption costs have plateaued. The unexplained gap was not fully closed. |
| Emmanuel Rosner | Wolfe Research, LLC | 2027 puts and takes | Rosner noted every 2027 driver management listed was a tailwind and asked for the headwinds. Jacobson acknowledged inflationary pressures are to be expected but declined to quantify anything, returning to the multi-year trajectory on warranty, EV profitability and digital revenue. The hardest exchange of the call on the forward case. |
| Dan Levy | Barclays Bank PLC, Research Division | Pricing power on the next-generation full-size pickup | Asked what specifically drives the pricing upside from an already dominant share position. Jacobson pointed to added features and a richer early trim mix and said GM would take price where it can, but declined to say how the truck will be priced. Barra added the real volume upside sits in 2028 once the engine plants and Orion are running. |
| Joseph Spak | UBS Investment Bank, Research Division | Super Cruise pricing as it becomes standard content | Spak asked whether the upfront option price or the monthly subscription changes as Super Cruise is democratized. Barra said there is nothing specific to announce. Jacobson redirected to attach rates in the 30% to 40% range and $6.3 billion of deferred revenue, leaving the pricing architecture question unanswered. |
| Rajat Gupta | JPMorgan Chase & Co, Research Division | Whether 2026 onshoring costs recur in 2027 | Asked if the $1 billion to $1.5 billion of onshoring and software spend contains one-time items. Jacobson said the bulk is recurring hiring and training cost, with the drag coming from staffing ahead of production, partly offset as volume ramps. He also said no significant additional autonomy or R&D investment is expected next year. |
| Andrew Percoco | Morgan Stanley, Research Division | Affordability and a possible mix shift toward crossovers | Asked whether guidance assumes consumers trade down to smaller vehicles. Barra rejected the premise flatly, saying the shift has been predicted for months and is not happening, and that GM is building everything it can sell in full-size trucks and utilities. |
| Mark Delaney | Goldman Sachs Group, Inc., Research Division | Micron memory agreement and 2027 DRAM cost visibility | Asked whether the expanded Micron collaboration gives a clear view of 2027 memory costs. Barra described strategic relationships with Micron and Samsung and a joint technology road map but said GM has not disclosed pricing, so the cost visibility question went unanswered. |
| Michael Ward | Citigroup Inc., Research Division | Scale of the new businesses versus GM Financial | Asked whether digital services, defense, insurance and energy could together contribute at or above GM Financial's level within five years. Jacobson would not give a number, pointing to deferred revenue disclosure, the revenue base already above $3 billion and historically disclosed OnStar margins around 70%. Barra endorsed the framing without sizing it. |
Theme tracker
Themes are curator-classified across supplied calls.
| Theme | Status | Quarters mentioned | Read-through |
|---|---|---|---|
| North America 8% to 10% EBIT-adjusted margin | persisted | Q4 2023, Q4 2024, Q1 2025, Q2 2025, Q3 2025, Q4 2025, Q1 2026, Q2 2026 | The single most durable commitment in the history. The framing moved through four stages: delivered (9.2% for full year 2024), then defended on an ex-tariff basis (roughly 9% excluding tariffs in Q2 and Q3 2025 against reported margins near 6%), then labelled an aspirational target in Q3 2025, then re-underwritten as a clear and achievable path for 2026, and finally reported at 8.6% in Q2 2026. Management never abandoned the number through the tariff trough, which is part of why the Q2 2026 delivery carries weight. |
| Tariffs and trade policy | persisted | Q4 2024, Q1 2025, Q2 2025, Q3 2025, Q4 2025, Q1 2026, Q2 2026 | Entered as a risk explicitly excluded from 2025 guidance, became the dominant Q&A topic for four straight calls, and has since compressed into a line item. Gross exposure went from $4 billion to $5 billion at the Q1 2025 reset, to $3.5 billion to $4.5 billion in Q3 2025, to $3.1 billion actual for 2025, to $2.5 billion to $3.5 billion for 2026. In Q2 2026 the topic surfaced only as a USMCA content question; the mitigation story has shifted from self-help offsets to onshoring capacity. |
| EV volume scale-up as the primary profit lever | dropped | Q3 2023, Q4 2023, Q1 2024, Q2 2024, Q3 2024, Q4 2024, Q1 2025, Q2 2025 | For seven consecutive calls GM anchored EV economics to volume: 200,000 to 300,000 Ultium units, variable profit positive in Q4 2024, a $2 billion to $4 billion year-over-year EBIT improvement on roughly 300,000 wholesales, mid-single-digit EV margins in 2025. From Q3 2025 the volume target disappears entirely and is replaced by capacity reduction. Q2 2026 offers no EV volume number at all, only that wholesales should be up slightly in the second half. This is the clearest abandoned commitment in the set. |
| EV capacity rightsizing and restructuring charges | emerged | Q3 2025, Q4 2025, Q1 2026, Q2 2026 | Began with a $1.6 billion charge in Q3 2025 and the Orion conversion from EV to ICE, then $6 billion more in Q4 2025 including the BrightDrop discontinuation, then $1.1 billion in Q1 2026 and $2.3 billion in Q2 2026. Cumulative charges reached $10.9 billion since the second half of 2025, of which about $7.2 billion is cash. Management now says the material cash charges are substantially complete, which if it holds removes a four-quarter overhang. |
| Warranty cost | persisted | Q3 2023, Q3 2024, Q4 2024, Q1 2025, Q2 2025, Q3 2025, Q4 2025, Q1 2026, Q2 2026 | Present on essentially every call for three years, and the one theme that has fully inverted. It ran from repair-cost inflation in 2023, through the L87 engine issue and a $900 million year-over-year headwind in Q3 2025, to a guided $1 billion benefit for 2026 raised to $1 billion to $1.5 billion in Q2 2026. The pivot point management named repeatedly was monthly warranty cash outflows flattening before accruals could follow. |
| Software and services revenue disclosure (OnStar, Super Cruise) | persisted | Q4 2024, Q1 2025, Q2 2025, Q3 2025, Q4 2025, Q1 2026, Q2 2026 | The disclosure has escalated every quarter, from a five-year Super Cruise revenue ambition in Q4 2024 to a standalone deferred-revenue metric that grew from $4 billion to $6.3 billion across four calls, with 2026 recognized revenue above $3 billion and gross margins described around 70%. It has also become the most-asked topic in recent Q&A, largely from Morgan Stanley, Citi and UBS. Worth watching because it is the part of the 2027 bridge with the most disclosure behind it. |
| Robotaxi and the Cruise business | dropped | Q3 2023, Q4 2023, Q1 2024, Q2 2024, Q3 2024, Q4 2024 | Cruise carried its own expense line, its own vehicle program and multiple analyst questions per call through 2024. GM stopped funding robotaxi development in Q4 2024, folded the team into North America, and the last analyst question about Cruise as a business came in Q1 2025. Autonomy did not disappear but was re-scoped: Barra said in Q3 2025 that GM is not in rideshare, and the target is now eyes-off, hands-off on the Cadillac Escalade IQ in 2028. |
| Onshoring U.S. production toward more than 2 million units | emerged | Q2 2025, Q3 2025, Q4 2025, Q1 2026, Q2 2026 | Started as a $4 billion capacity announcement framed as tariff mitigation, then expanded with additional Equinox capacity in Kansas and the Orion conversion. It now carries a cost as well as a benefit: $1 billion to $1.5 billion of 2026 spend on onshoring, supply chain and software, weighted to the second half, with Escalade production moving to Orion. The benefit is claimed for 2027 and beyond, so this theme is currently all cost and no proof. |
| Commodity, logistics and DRAM inflation | emerged | Q4 2025, Q1 2026, Q2 2026 | Introduced at $1 billion to $1.5 billion for 2026, raised to $1.5 billion to $2 billion in Q1 2026 on the Iran conflict, and held there in Q2 2026 with the headwind weighted to the second half. This is the only quantified 2026 headwind that has been revised upward, and management explicitly excluded further escalation from guidance. It is also the item most likely to carry into 2027 given the lag in how the costs flow through. |
| Non-automotive growth businesses (GM Defense, GM Insurance, energy storage) | emerged | Q2 2026 | Barra devoted a large block of prepared remarks to GM Defense revenue growing to almost $700 million in 2026 with a targeted growth rate above 30%, GM Insurance scaling from 3 states to 21, and a sodium-ion battery position through Peak Energy. Only one call so far, and management repeatedly declined to size the contribution, so treat this as a narrative under construction rather than an established theme. |
Guidance ledger
Quotes, calls, and speakers are source-verified; outcomes are curator-classified.
| Verbatim guidance | Call | Speaker | Curator outcome | Outcome note |
|---|---|---|---|---|
| “we are narrowing full year 2024 guidance to EBIT adjusted to the $14 billion to $15 billion range, EPS diluted adjusted to the $10 to $10.50 a share range, which are both at the high end of our prior guidance” | General Motors Company, Q3 2024 Earnings Call, Oct 22, 2024 · 2024-10-22T12:30:00 | Paul Jacobson | kept | The Q4 2024 call reported full year EBIT adjusted of $14.9 billion, at the high end of the October range, and EPS diluted adjusted of $10.60. |
| “We expect EBIT-adjusted in the $13.7 billion to $15.7 billion range, EPS diluted adjusted to be in the $11 to $12 per share range and adjusted automotive free cash flow in the $11 billion to $13 billion range.” | General Motors Company, Q4 2024 Earnings Call, Jan 28, 2025 · 2025-01-28T13:30:00 | Paul Jacobson | missed | This guide explicitly excluded future policy changes. It was reset to $10 billion to $12.5 billion on the Q1 2025 call once tariffs were quantified, and the Q4 2025 call reported full year 2025 EBIT adjusted of $12.7 billion, below the original range. |
| “we anticipate EV profitability improvements at the low end of our $2 billion to $4 billion EBIT year-over-year target. This improvement is based on wholesales of around 300,000 units” | General Motors Company, Q4 2024 Earnings Call, Jan 28, 2025 · 2025-01-28T13:30:00 | Paul Jacobson | missed | By Q3 2025 Barra said near-term EV adoption would be much lower than planned, and GM began reducing EV capacity. No 300,000-unit wholesale figure appears in any later call, and $10.9 billion of EV-related charges were recorded from the second half of 2025 through Q2 2026. |
| “we are expecting a $4 billion to $5 billion impact from tariffs” | General Motors Company, Q1 2025 Earnings Call, May 01, 2025 · 2025-05-01T12:30:00 | Paul Jacobson | missed | Gross tariff exposure was lowered to $3.5 billion to $4.5 billion in Q3 2025 and the Q4 2025 call reported $3.1 billion for the full year, below the original range. The variance was favorable, driven by the expanded MSRP offset and a lower Korea rate. |
| “This results in EBIT adjusted in the $10 billion to $12.5 billion range, EPS diluted adjusted in the $8.25 to $10 per share range and adjusted automotive free cash flow in the $7.5 billion to $10 billion range.” | General Motors Company, Q1 2025 Earnings Call, May 01, 2025 · 2025-05-01T12:30:00 | Paul Jacobson | kept | Raised to $12 billion to $13 billion in Q3 2025 and delivered at $12.7 billion of EBIT adjusted and $10.6 billion of adjusted automotive free cash flow, both above the top of this May range. |
| “we are raising our calendar year 2025 guidance to EBIT-adjusted of $12 billion to $13 billion, EPS diluted adjusted of $9.75 to $10.50 per share and adjusted automotive free cash flow of $10 billion to $11 billion” | General Motors Company, Q3 2025 Earnings Call, Oct 21, 2025 · 2025-10-21T12:30:00 | Paul Jacobson | kept | The Q4 2025 call reported $12.7 billion of EBIT adjusted and $10.6 billion of adjusted automotive free cash flow, both inside the raised ranges. |
| “Now let's turn to our 2026 guidance, where we expect EBIT adjusted of $13 billion to $15 billion, EPS diluted adjusted of $11 to $13 per share and adjusted automotive free cash flow of $9 billion to $11 billion.” | General Motors Company, Q4 2025 Earnings Call, Jan 27, 2026 · 2026-01-27T13:30:00 | Paul Jacobson | pending | Raised to $13.5 billion to $15.5 billion in Q1 2026 and to $14 billion to $16 billion in Q2 2026. The year is not complete in the supplied call history. |
| “we are seeing positive trends in warranty costs, which are expected to deliver $1 billion benefit versus 2025” | General Motors Company, Q4 2025 Earnings Call, Jan 27, 2026 · 2026-01-27T13:30:00 | Paul Jacobson | pending | Tracking ahead. Q1 2026 reported roughly $200 million of first-quarter improvement, and Q2 2026 raised the full-year assumption to $1 billion to $1.5 billion with $500 million realized in the first half and most of the remainder expected in the third quarter. |
| “we anticipate gross tariff costs in the $3 billion to $4 billion range” | General Motors Company, Q4 2025 Earnings Call, Jan 27, 2026 · 2026-01-27T13:30:00 | Paul Jacobson | pending | Lowered to $2.5 billion to $3.5 billion in Q1 2026 after the IEEPA accounting adjustment tied to the Supreme Court decision. Approximately $1.3 billion was incurred through the first half of 2026, net of a $500 million IEEPA benefit. |
| “We now expect EBIT adjusted of $14 billion to $16 billion, up from $13.5 billion to $15.5 billion. EPS diluted adjusted of $12 to $14, up from $11.50 to $13.50 per share and adjusted automotive free cash flow of $9.5 billion to $11.5 billion, up from $9 billion to $11 billion previously.” | General Motors Company, Q2 2026 Earnings Call, Jul 21, 2026 · 2026-07-21T12:30:00 | Paul Jacobson | pending | Second raise of 2026. First-half EBIT adjusted was $8.2 billion. Guidance assumes no material escalation in the Middle East and no significant increase in inflationary pressure from current levels. |
Q&A pressure map
Question counts and firms are curator tallies; analyst coverage shown above.
| Topic | Questions | Firms | Pressure / response |
|---|---|---|---|
| Pricing, incentives and the pricing walk | 31 | Barclays Bank PLC, UBS Investment Bank, JPMorgan Chase & Co, Evercore ISI Institutional Equities, TD Cowen | The only topic raised in every one of the last eight calls, and the most persistent. Analysts repeatedly challenged the gap between third-party pricing data and GM's pricing bridge, and pushed on whether the planning assumption is a forecast. Management has been consistent and reasonably direct here, repeatedly describing the guide as a planning convention rather than an expectation, and the outcome has usually landed better than the assumption. |
| Guidance construction and the EBIT bridge | 24 | Barclays Bank PLC, TD Cowen, BNP Paribas, UBS Investment Bank, Evercore ISI Institutional Equities | A standing line of attack: analysts add up the disclosed walk items, find they do not reconcile to the guide, and ask what is missing. It recurred in Q4 2025 from Wells Fargo, in Q2 2026 from Barclays, and in Q4 2025 from BNP Paribas on the North America margin math. Answers tend to resolve into unquantified core margin improvement rather than a closed bridge, which is the softest spot in an otherwise well-disclosed set of remarks. |
| Tariffs, trade deals and mitigation | 23 | UBS Investment Bank, JPMorgan Chase & Co, BofA Securities, Morgan Stanley, Citigroup Inc. | Concentrated in the four calls from Q4 2024 through Q3 2025, when analysts pressed hard on the size of the gross number, what was and was not assumed for Korea, Mexico and Canada, and how much of the offset was really pricing. Management held to a disclosed three-bucket framework and, unusually, over-delivered against it. Pressure has since dissipated. |
| Super Cruise, OnStar and digital services economics | 18 | Morgan Stanley, Citigroup Inc., UBS Investment Bank, Goldman Sachs Group, RBC Capital Markets | The fastest-growing pressure point, and now the largest topic in the most recent call. Questions have moved from attach rates to harder ground: addressable car park, hardware gating, ARPU versus Tesla, and pricing architecture. The Q2 2026 exchange with UBS on whether Super Cruise pricing changes as it becomes standard content did not get an answer; Citi's question on activating the existing car park drew a partial one, with Barra citing roughly 22 million vehicles that received an over-the-air update. |
| China | 13 | JPMorgan Chase & Co, RBC Capital Markets, Morgan Stanley, Goldman Sachs Group, BofA Securities | Sustained pressure through 2024 and 2025 as losses, restructuring charges and the durability of the turnaround were probed quarter after quarter. Q2 2026 was the first call in the set with no dedicated China question, which tracks the equity income line stabilizing and management's disclosure shrinking to a couple of sentences. |
| Autonomy road map | 12 | Morgan Stanley, JPMorgan Chase & Co, TD Cowen, BofA Securities, RBC Capital Markets | Questioning shifted alongside the strategy: from Cruise funding, the Origin and robotaxi timing in 2024 to eyes-off timing, supervised on-road testing and long-term autonomy pricing in 2026. Answers on milestones have consistently been deferred rather than dated, with the 2028 Escalade IQ launch the only fixed marker. |
| EV losses, capacity and restructuring charges | 8 | Wolfe Research, Evercore ISI Institutional Equities, Barclays Bank PLC, Goldman Sachs Group, Morgan Stanley | Notably lighter than the size of the charges would suggest. Wolfe and Evercore probed how much structural cost the writedowns actually remove, and Barclays asked in Q4 2025 whether the fixed cost base still matches an ICE-heavier mix. Management sized the charges precisely but never quantified the resulting run-rate cost reduction, and no analyst forced the point in Q2 2026. |
| Commodity, logistics and DRAM inflation | 9 | Barclays Bank PLC, Wolfe Research, Goldman Sachs Group, BofA Securities, TD Cowen | Newer pressure that arrived with the Q4 2025 guide and intensified in Q1 2026 around hedging, contract structure and shortage risk. Goldman's Q2 2026 question on whether the Micron agreement gives 2027 memory cost visibility was answered with relationship detail rather than cost detail. |
| Warranty | 5 | UBS Investment Bank, Barclays Bank PLC, Wolfe Research | Surprisingly few direct questions given how large the swing has been, and concentrated in UBS. That is partly because management pre-empted it in prepared remarks for several quarters running, including unusually blunt self-criticism in Q2 and Q3 2025. |
Language shifts
Only language evidence verified against the referenced component is shown.
| Observation | Verbatim evidence | Call ID | Component |
|---|---|---|---|
| Warranty language reached its most self-critical point in Q3 2025, with an unqualified admission rather than the usual framing around repair-cost inflation. It is the clearest instance in the set of management naming a problem before an analyst did. | “Warranty expense was a $900 million headwind year-over-year in the third quarter. This is too high, and we need to do better.” | 1961672012 | 3 |
| The EV language turned in Q3 2025. Prior calls described a slower but still upward trajectory; this was the first time management stated the planning assumption itself had been wrong, in the same remarks that still called EVs the company's North Star. | “it's clear that near-term EV adoption will be much lower than planned” | 1961672012 | 2 |
| In Q3 2025 the North America margin target was demoted from a commitment to an aspiration, paired with defensive framing about not making excuses. This was the low point in confidence on the company's central financial promise. | “that's our aspirational target, and we're not making excuses about what's happening to us” | 1961672012 | 31 |
| By Q2 2026 the same target is described as achieved and held, three quarters after being called aspirational. The shift from conditional to declarative language on this specific number is the single largest confidence change across the history. | “Having worked through much of that pressure, we are solidly back within our 8% to 10% margin target” | 2007275320 | 3 |
| Q1 2026 introduced explicit war and duration-uncertainty vocabulary into the guidance rationale, a category of risk absent from earlier calls where uncertainty language centred on trade and regulation. The Q2 2026 guide still carries a Middle East escalation caveat. | “the war in Iran has raised our costs and its duration remains uncertain” | 1992004510 | 2 |
| Language on EV charges moved from open-ended to closing. In Q3 2025 further charges were expected but unsized; in Q2 2026 management asserted completion, hedged only by a reference to possible true-ups. | “we believe these actions substantially complete the material cash charges we expect to incur as we align our EV capacity and manufacturing footprint with the changes in regulatory policy” | 2007275320 | 3 |
| Q2 2026 prepared remarks adopted a new comparative and slightly combative register, benchmarking GM's margin trajectory against the peer set rather than against its own prior guidance. It reads as a company arguing it has been underrated rather than one defending a shortfall. | “We haven't made excuses. We've just continued to perform.” | 2007275320 | 2 |
Twelve calls make the recovery case concrete rather than promissory: the North America margin target survived being downgraded to an aspiration and was delivered at 8.6%, warranty flipped from a $900 million quarterly headwind to a guided full-year benefit, and the EV charges look closed. What the history does not yet support is the 2027 step-up. Every driver management named for next year is a tailwind, the one quantified headwind has already been revised upward twice, and the newest growth stories - GM Defense, GM Insurance, energy storage - have exactly one call of disclosure behind them and no sizing. The debate is no longer whether GM can execute through disruption; it is whether the next leg of margin expansion is as one-sided as the prepared remarks imply.
Competitors describe General Motors Company's market in their own filings and calls. These verified passages and visual pages show where their strategies meet, using source documents preserved in Sources.
Ford Motor Company (F)
The closest competitor GM has: the same U.S. home market, the same full-size pickup and large-SUV profit pools, the same UAW cost base, the same commercial-fleet customers, and a captive finance arm alongside. Ford is one of the two rivals its own management is describing when it talks about "our two largest competitors" in Class 1–7 trucks and "our key competition" in full-size pickups. Exhibits here are confined to the North American truck, fleet and pricing discussion, where the overlap with Chevrolet Silverado / GMC Sierra, Tahoe / Suburban and GM Envolve is direct; Ford's aluminum-supply (Novelis) and Ford Energy storage commentary is left out.
An analyst asks Ford directly about "competitors out there that are sort of trying to regain share in North American trucks" — the segment where Silverado and Sierra sit against F-Series — and the head of Ford Blue answers on the record. The claims are Ford's own and unaudited: two points of revenue share and one and a half points of volume share gained in 2025, and truck leadership "expanded… over our key competitors each of the last two years." Note what is being measured — share of the full-size pickup segment, on Ford's definition, not total U.S. share, and revenue share moved more than volume share, which is a mix and transaction-price statement as much as a units one. The closing line is the operative one for GM: Ford says it intends to hold the segment by managing stock and incentive spend rather than by discounting into share.
Joseph Spak (Analyst) and Andrew Frick (President of Ford Blue and Model E): Okay. Thank you for that. And then just the second question, another one, I guess, on market factors. I wanna focus, I guess, specifically on two areas. You know, one is you've got some competitors out there that are sort of trying to regain share in North American trucks and European LCVs. So how do you think about the market impact there? […] Yeah, Joe. It's Andrew Frick. First of all, let me comment on the first part around full-size pickup. That is always a competitive segment, so this is nothing new for us. And as the leader, we have to be ready for challenges at all times. We have a great pickup lineup right now. Great F Series lineup, covering the breadth of the entire segment, and we've actually been growing. In fact, last year, as Jim mentioned, we grew two points of revenue share and one and a half points of volume share in 2025, and we've actually expanded our truck leadership position over our key competitors each of the last two years and by a sizable margin. But as we enter this year, in '26, we, of course, always approach it humbly. Our dealer network is really set up and is a real strength for us. They continue to invest in the truck business. Our stock positions are on the low end of our day supply range right now, and our overall market approach is to remain disciplined in our market equation, balancing stock share and our incentive spending.
p. 7 · Read in context →
Ford's CFO puts a three-part claim on the Q1 2026 call: for the quarter, F-150 had the highest retail share, the highest average transaction price and the lowest incentive spend per unit "versus our key competition" — the peer set that is principally Silverado, Sierra and Ram. All three are Ford's own characterisations, with no source or comparison set disclosed, and the "highest retail share" is measured on retail only, excluding fleet, where GM's mix differs. Taken at face value it is a claim to be winning volume and price simultaneously while spending less to do it; that combination, if it persists, is what compresses a competitor's pricing headroom in the segment.
Sherry House (CFO): Third, relative to U.S. inventory, we expect to remain within our target of 55 to 65 retail days supply for the year. F-Series sales remain healthy as inventory recovers from the Novelis supply disruption. America's best-selling truck delivered year-over-year retail share improvement of 30 basis points in March, and we are carrying that momentum into Q2. Our team is effectively managing tight retail day supply by helping dealers fill inventory gaps while ensuring high demand trim levels are in ample supply. We are also producing a richer mix of product as we continue to ramp Novelis. And importantly, on average, we are spending less on incentives than our competitors. In fact, for the quarter, F-150 had the highest retail share, highest average transaction price and the lowest incentive spend per unit versus our key competition.
p. 2 · Read in context →
Ford's framing of its commercial-vehicle position, from the FY2025 results call (the sentence begins on the previous page: "In the U.S., Ford Pro's class one through / seven market share is over 42%"). The comparison is the notable part — Ford states its Class 1–7 share is roughly the size of its two largest competitors combined, a set that includes GM. It is a share-of-segment claim on Ford's own definition of Class 1–7 and is not reconciled to any third-party registration data. The second half is the strategic collision rather than the share one: Ford is attaching software and physical services to the fleet relationship, reporting those at 19% of Ford Pro EBIT against a 20% target — the same recurring-revenue ground GM is contesting with GM Envolve and OnStar fleet services.
Jim Farley (President and CEO): […] seven market share is over 42%, roughly the size of our two largest competitors combined. In Europe, with the number one commercial brand, for the eleventh straight year. […] Software and physical services grew 10% and now contribute 19% for Ford Pro's EBIT, rapidly approaching our 20% target. And we continue to deepen our competitive moat. Thanks to our dealers, we're specializing in investing in more and forming new partnerships like ServiceTitan to broaden our reach and integrate directly with the trades.
p. 2 · Read in context →
Stellantis N.V. (STLA)
Stellantis is the other Detroit truck-and-SUV franchise — Ram against Silverado and Sierra, Jeep against Chevrolet and GMC utilities, and the same UAW plants and dealer network economics. Its 20-F is unusual among GM's peers in that it publishes market-share tables that name GM by automaker for both of its largest markets, the U.S. and Brazil, giving an outside-in read on GM's position in the two places GM sells most. Only the North America and South America vehicle discussion is used; the Enlarged Europe, Middle East & Africa, Maserati and Leapmotor material is out of scope.
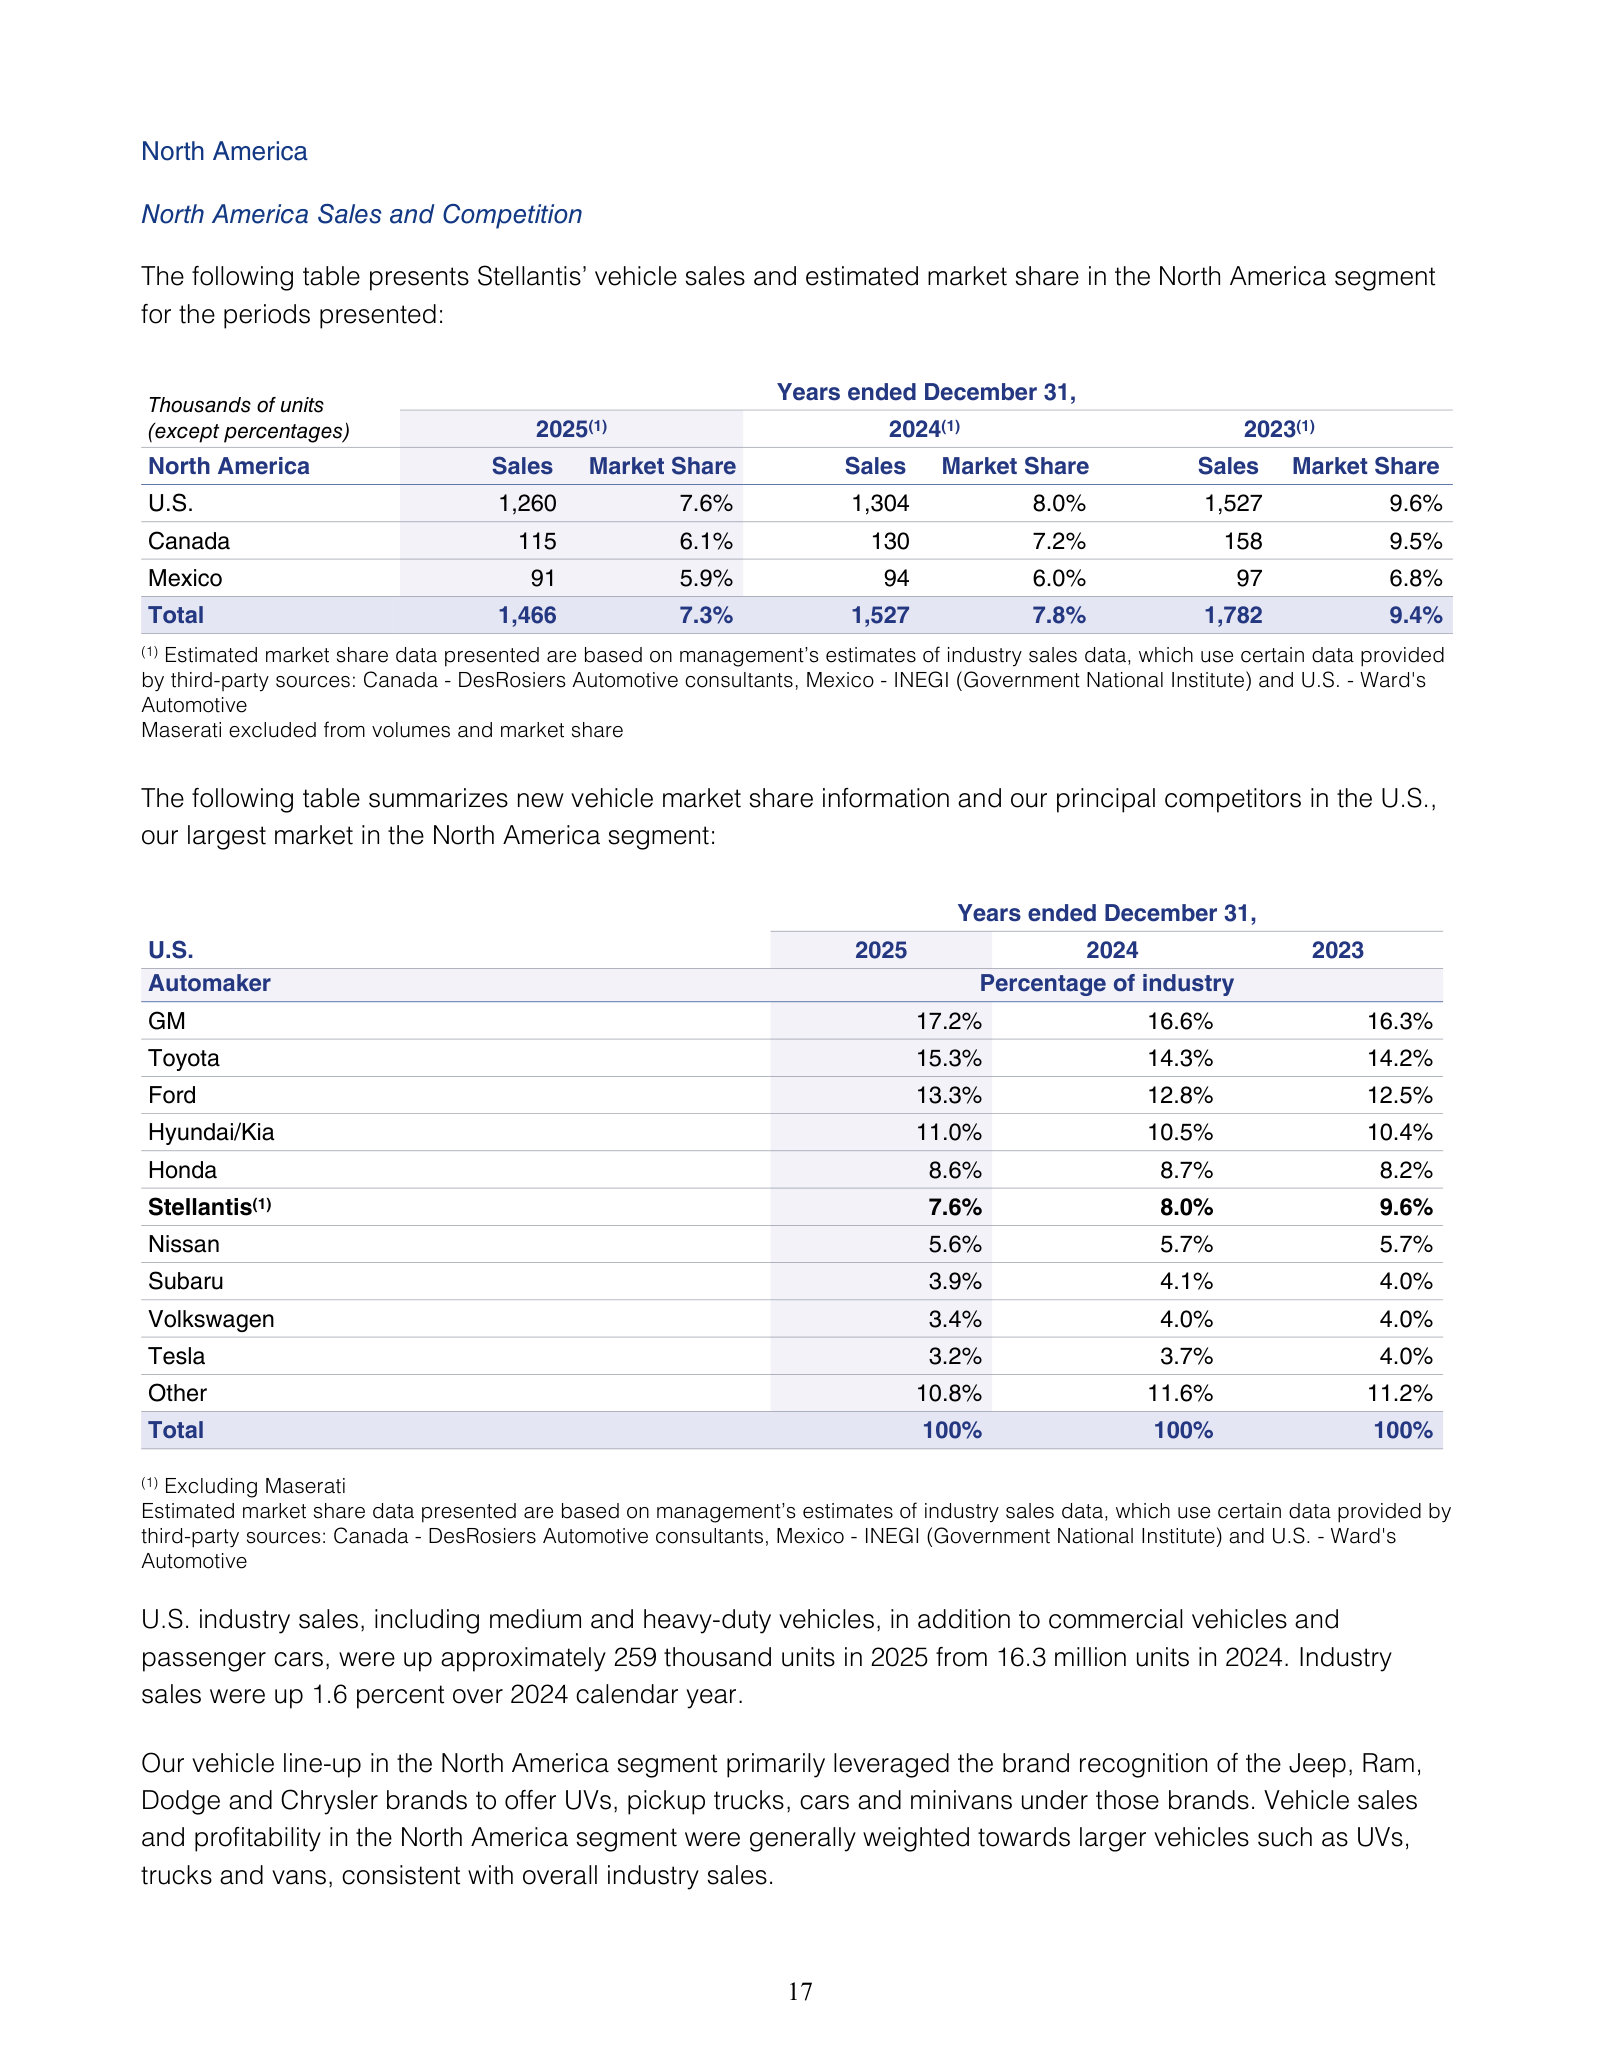
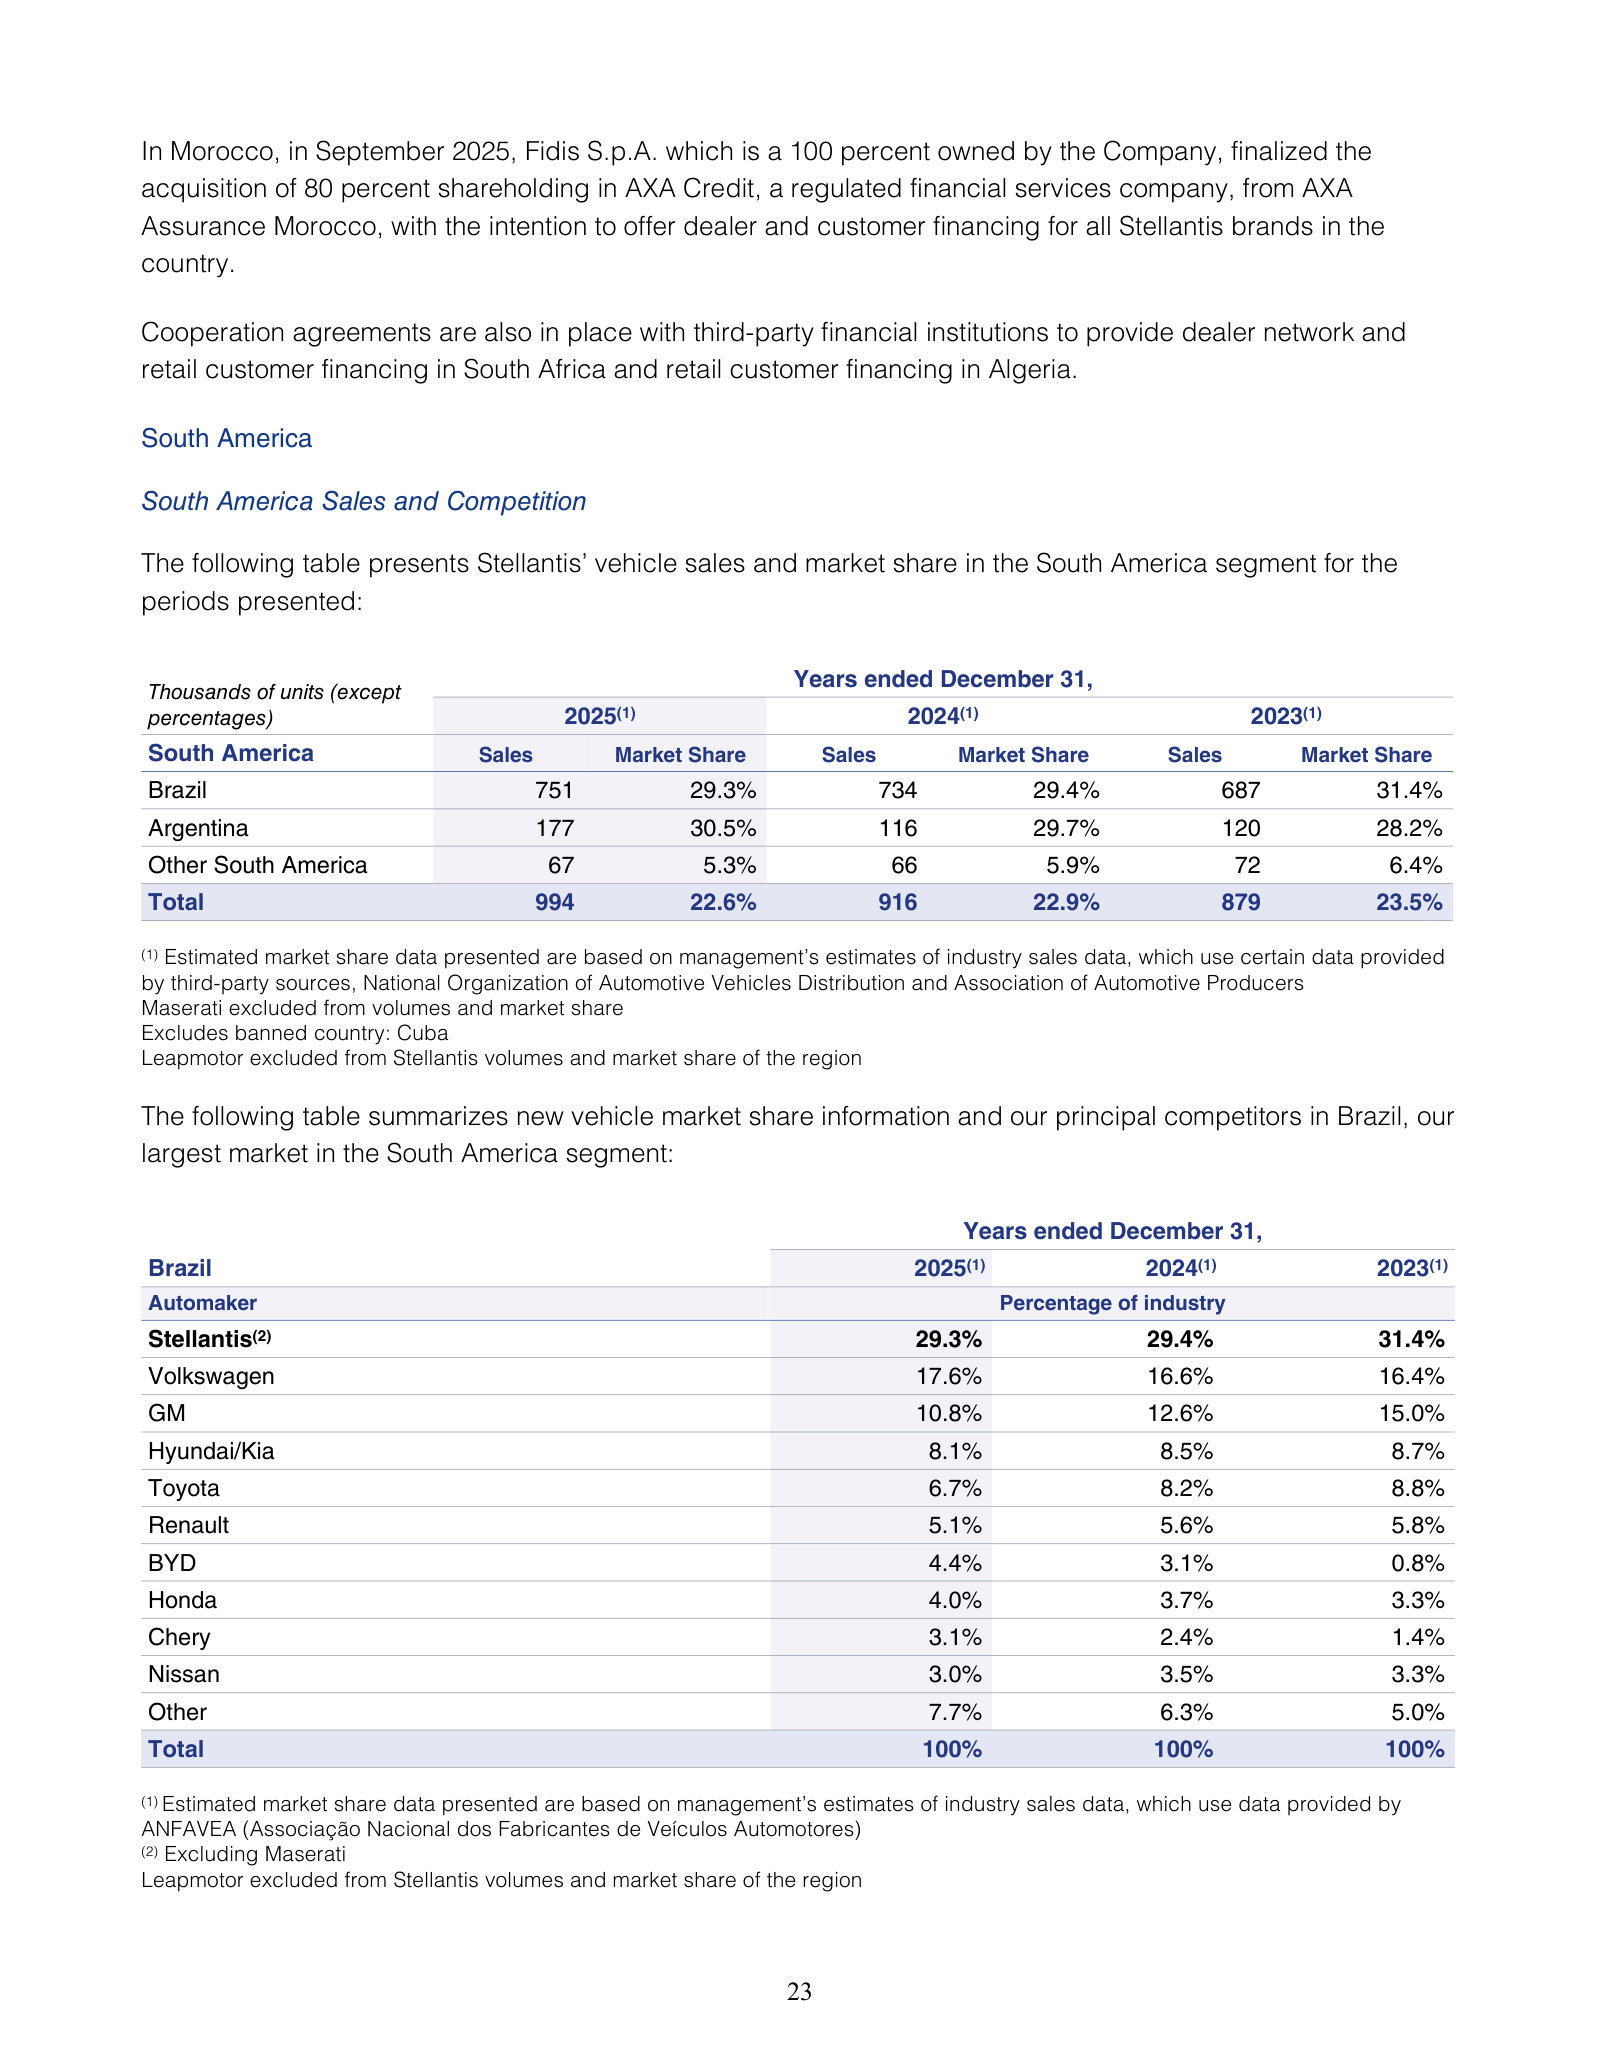
Asked what Stellantis will offer U.S. buyers below $40,000, the CEO concedes low current penetration there and commits part of a $13 billion four-year U.S. investment to the segment, plus a Ram midsize pickup for Q4 2027. Both statements point at ground GM occupies: the sub-$40,000 band where Trax, Trailblazer and Equinox are GM's volume answer, and the midsize pickup segment held by Colorado and Canyon, which has had no Ram entrant since 2011. This is a stated plan with a date, not a shipped product, and Stellantis is announcing it from a position of 7.6% U.S. share and a loss-making 2025; the relevance is that it adds a competitor to two segments rather than that it displaces anyone yet.
Antonio Filosa (Chief Executive Officer): Okay, I will start. So when we look at US and when we look at the sub $40,000 US dollar market, for sure, this is a portion of the market where our current penetration is low. And we are investing within the $13 billion investment over the next four years, also in that part of the segment. We will deliver products to be credible players, also, in the below 40k US dollar portion of the market, which is very large. I will give you an example that we already announced around additional affordability on our line-up. Well, the Ram will launch a midsize pickup truck that we will develop now, and we will launch to the market by quarter four 2027.
p. 11 · Read in context →
Tesla, Inc. (TSLA)
Tesla is the volume leader in the U.S. electric market GM has spent the most capital trying to enter, and the reference point for two of GM's stated growth vectors: affordable EVs and hands-off driver assistance sold as software. Only the automotive and FSD discussion is used here — the energy storage, Optimus, Terafab and solar-cell material is a different business and is excluded, even though it dominates the calls.
How Tesla defines its own competitive set in its FY2025 Form 10-K. Two things matter for GM. First, Tesla says it competes on traditional segment classification as well as propulsion — Cybertruck against pickup trucks, Model Y against compact SUVs — which is the same framing that puts it against Silverado EV and Equinox EV rather than only against other EVs. Second, the autonomy paragraph places Tesla's Robotaxi service in competition with ride-hailing and taxi services, and cites the Supercharger network as part of the offer. This is boilerplate 10-K competition language and names no rival; it is useful as Tesla's own statement of where it thinks the fight is, not as evidence about relative position.
Item 1. Business — Competition: The worldwide automotive market is highly competitive and we expect it will become even more competitive in the future as a significant and growing number of established and new automobile manufacturers, as well as other companies, have entered, or are reported to have plans to enter the electric vehicle market.
We believe that our vehicles compete in the market based on both their traditional segment classification as well as their propulsion technology. For example, Cybertruck competes with other pickup trucks, Model S and Model X compete primarily with premium sedans and premium SUVs and Model 3 and Model Y compete with small to medium-sized sedans and compact SUVs, all of which are extremely competitive markets. Competing products typically include internal combustion vehicles from more established automobile manufacturers; however, many established and new automobile manufacturers have entered or have announced plans to enter the market for electric and other alternative fuel vehicles. Overall, we believe these announcements and vehicle introductions promote the development of the electric vehicle market by highlighting the attractiveness of electric vehicles relative to internal combustion vehicles. Many major automobile manufacturers have electric vehicles available today in major markets including the U.S., China and Europe, and other current and prospective automobile manufacturers are also developing electric vehicles. In addition, several manufacturers offer hybrid vehicles, including plug-in versions. […] As we seek to become a top provider of autonomous solutions, we also face competition in the fields of AI and robotics. We expect our Robotaxi service to compete in this developing market, along with traditional ride-hailing and taxi services, through continued progress on our FSD (Supervised) and neural network capabilities, Supercharger network and infotainment offerings.
p. 13 · Read in context →
Tesla's read on the electric pickup segment, answering a shareholder question about whether it would build a conventional-looking truck. The claim is bounded: Cybertruck outsells other electric trucks — a segment that includes Silverado EV, Sierra EV and Hummer EV — not that it outsells pickups generally, and no volumes are given. The second sentence is the one to weigh: "Our competition continues to pull back" is Tesla's characterisation of rivals scaling back electric truck programmes, offered without specifics. GM has publicly slowed EV truck output, so the direction is consistent with the record, but the sentence is an assertion about competitors made by an interested party.
Shareholder question via say.com and Lars Moravy (VP of Vehicle Engineering): After the unveil of the Cybertruck, Elon stated tha if it didn't sell well, Tesla would build a more conventional-looking pickup. How practical would it be to create this new design on the Cybertruck architecture, and could it be conveniently built on the existing production lines?
Lars Moravy (VP of Vehicle Engineering):
Actually, in its segment, CyberTruck can be a leader and is selling more than any other electric truck out there. Our competition continues to pull back.
p. 6 · Read in context →
Toyota Motor Corporation (TM)
Toyota is the automaker closest behind GM in U.S. share — 15.3% against GM's 17.2% in 2025 on Stellantis' published estimates, and closing — and it is the company that made hybrids, rather than battery-electrics, the profitable middle path in North America. That is directly relevant to GM, which has comparatively little hybrid volume in its U.S. lineup. Only the consolidated automotive and electrification commentary is used; the Hino deconsolidation, Toyota Industries buyout and Japan governance material is set aside. Note these transcripts are third-party (Quartr via MarketBeat) captures of the results briefing and are truncated before the Q&A.
Toyota's own scorecard for the year to March 2026: 10,477,000 Toyota and Lexus vehicles, and electrified sales above 5 million units for the first time, "primarily driven by HEVs that were well-received in regions such as North America and China." The framing is Toyota's — "price revisions underpinned by strong product competitiveness" is a claim to pricing power, not a measurement of it, and operating income still fell to ¥3.8 trillion under U.S. tariffs. The volumes are the point for GM: roughly half of Toyota's global sales now carry an electrified powertrain, overwhelmingly conventional hybrids, and North America is named as a lead region for that mix.
Takanori Azuma (Accounting Group Chief Officer): Operating income for fiscal year 2026 amounted to JPY 3.8 trillion. Despite the impact of U.S. tariffs, we were able to secure profits in line with our guidance due to increased vehicle sales volumes and the effects of price revisions underpinned by strong product competitiveness as well as steadily accumulated improvement efforts, such as expanded value chain profits. […] Consolidated vehicle sales for this fiscal year reached 9,595,000 units, or 102.5% year-on-year. Toyota and Lexus vehicle sales totaled 10,477,000 units or 102.0% over the previous fiscal year. Thanks to strong demand from customers, mainly in Japan and North America, vehicle sales increased. Sales of electrified vehicles exceeded 5 million units for the first time, primarily driven by HEVs that were well-received in regions such as North America and China, while PHEVs and BEVs also posted volume growth.
p. 9 · Read in context →
Honda Motor Co., Ltd. (HMC)
Honda holds roughly 8.6% of the U.S. market and competes with GM across crossovers and mid-size pickups, but the sharper connection is strategic: Honda's two current North American EVs, the Prologue and Acura ZDX, are built by GM under the companies' platform agreement, and Honda has now written off its own North American EV programme and redirected the region to internal-combustion and hybrid volume. Only the automobile-business discussion is used; motorcycles, which carry Honda's record profits, and power products are excluded.
Honda quantifies its retreat from North American electric vehicles: cancelling the launch and development of EV models scheduled for North American production produced ¥1,310.6 billion of additional fourth-quarter losses, taking full-year EV-related losses to ¥1,577.8 billion and turning a ¥1,039.3 billion adjusted operating profit into a ¥414.3 billion reported loss. The figures are Honda's own, and the split between adjusted and reported profit is Honda's presentation. For GM the read-through is twofold — a second large manufacturer has concluded the North American EV volume it planned is not there, and the capacity and battery supply behind those cancelled models leaves the market.
Financial results briefing for FYE March 31, 2026 (May 14, 2026): In addition, as we explained on March 12, the cancellation of the launch and development of EV models that had been scheduled for production in North America resulted in additional losses of 1 trillion 310.6 billion yen in the fourth quarter.
As a result, total EV-related losses for the fiscal year ended March 2026 amounted to 1 trillion 577.8 billion yen.
Consequently, operating profit for the fiscal year ended March 2026 was a loss of 414.3 billion yen.
Excluding the 1 trillion 453.6 billion yen in EV-related losses, operating profit was 1 trillion 39.3 billion yen.
p. 2 · Read in context →
Honda's strategy slide from the February 2026 results deck, in management's own words. Three elements collide with GM. Honda states its automobile profitability rests on internal-combustion and hybrid technology, not electrification; it says it will "clear up as much of the losses possible related to EVs currently marketed in North America" — the vehicles GM builds for Honda on its platform; and it commits to next-generation hybrid systems plus next-generation ADAS fitted to hybrids, which puts advanced driver assistance into mainstream hybrid price points rather than reserving it for EVs or premium trims. The profitability claim excludes tariffs and one-time EV expenses, which is a substantial exclusion.
Management Direction in Light of Changes in the Business Environment: In automobile business, leveraging the internal combustion engine and hybrid technologies we have cultivated over many years, we have maintained a business structure capable of steadily generating profits for the nine months ended December 31, 2025, excluding the impacts of tariffs and one time EV related expenses. […] Under these circumstances, we believe our key challenge is to build a lean business structure that can respond flexibly to changes in the business environment, while achieving product and cost competitiveness that surpasses that of emerging OEMs.
To address these challenges, we aim to clear up as much of the losses possible related to EVs currently marketed in North America within the current fiscal year.
At the same time, we are exercising disciplined control over expenditures in line with the business environment, and making swift management decisions aligned with trends in the electrification market, including a review of our EV model lineup and capital expenditure plans.
Meanwhile, to further enhance the profitability of our hybrid models, we are preparing for the launch of next generation hybrid systems, as well as the introduction of next generation ADAS in hybrid models as well.
p. 20 · Read in context →
The forward plan that follows from the write-off: for the year to March 2027 Honda intends to grow North American volume by "primarily strengthen[ing] ICE/HEV sales." The accompanying unit table on page 14 of the same deck puts numbers on it — North American automobile sales guided from 1,605 thousand to 1,705 thousand units, a 100 thousand unit increase that is the largest single regional gain in the forecast. This is guidance, not a result, and it is set against a year in which Honda's North American automobile volumes fell. The competitive fact for GM is the direction: incremental Honda volume in GM's home market is planned to arrive in combustion and hybrid segments, not electric ones.
Financial Forecast for FYE March 31, 2027: Operating profit 500.0 billion yen(Adjusted operating profit excluding EV-related losses :1 trillion yen) Despite the situation in the Middle East & higher material costs, target adjusted OP in line with the previous year via Motorcycles vol. gains & efficiency (fixed-cost cuts).
Motorcycle business: By expanding production capacity in India and other measures, we plan to capture strong demand and target record-high sales of 22.8 mil. units.
Automobile business: In Asia, we will support unit sales through model updates, while in North America will primarily strengthen ICE/HEV sales to increase volumes.
p. 3 · Read in context →
More peer documents
Stellantis — Q3 2025 shipments and revenues call — Q3 FY2025 · 14 pages · Pages 4–5 lay out the $13 billion U.S. investment in full: five new vehicles, U.S. production up 50%, Ram returning to both the midsize truck and large SUV segments by 2028, and a stated 12% North American commercial-vehicle share — the plan that puts Ram back against Colorado, Tahoe and Silverado HD. · Open →
Stellantis — FY2024 Form 20-F — FY2024 · 307 pages · Pages 18 and 24 carry the prior-year versions of the same U.S. and Brazil share tables naming GM, giving a five-year run when combined with FY2025; pages 28 and 83 set out the GM v. FCA US racketeering litigation history from Stellantis' side. · Open →
Ford Motor Company — FY2025 Form 10-K — FY2025 · 180 pages · Page 9 gives Ford's sales, industry-volume and share table for nine markets (U.S. share 13.2% of a 16.7 million unit industry) plus a U.S. split of electric, hybrid and combustion sales — the cleanest peer-side sizing of the powertrain mix GM is exposed to. · Open →
Tesla — Q2 2026 earnings call — Q2 FY2026 · 12 pages · Pages 3–5 give the latest FSD and robotaxi metrics — about 55% of North American deliveries with FSD enabled at delivery, nearly 1.5 million paid customers, 380,000 unsupervised robotaxi miles across six cities — the benchmark set GM's Super Cruise and autonomy disclosures get measured against. · Open →
The answer
Does not fit the framework (P1 not met); contested: P2.
General Motors is a car company, and the framework excludes car companies by name (X1). Underneath that exclusion sits the reason it matters: the pure year-10 durability gate (P1) does not hold, and a gate is a gate — nothing offsets it. Confidence is medium: probability spreads were at most 0.25 or one non-load-bearing criterion was contested. One criterion is contested — P2, free-cash-flow consistency — and China carries a sensitivity flag (S1). The name is not routed to watchlist-only; the instrument context (I1) is a fact GM meets, not a reason to exclude.
Here is the decisive point. Every valuation and self-help pillar GM is asked to clear, it clears — a double-digit forward cash yield, a net-cash industrial balance sheet, a share count down 38% in a decade. It fails anyway, because the framework's one binary gate asks whether year-10 revenue and free cash flow will be higher with very high conviction, and for a no-moat, capital-intensive cyclical mid-transition that conviction is not available.
Universe and exclusions — unsoftened
X1 — car company: a direct hit. GM is an auto manufacturer (SEC SIC 3711), the single industry the framework names as an exclusion. Its own 10-K supplies the confirming evidence: GM "operate[s] in a highly competitive industry that has historically had excess manufacturing capacity" [1]. The counter-fact in the same breath: GM is the US share leader at 17.2% and holds roughly a third of the US full-size truck pool, its most profitable franchise [2]. But leadership is precisely what the exclusion discounts: in an oversupplied industry, being first among near-equals does not confer pricing power. This is the "cheap car company" the framework has paid for before.
S1 — China: a sensitivity, not an exclusion. GM's China business runs through equity-method JVs, so it is off-balance-sheet operating exposure, not a Chinese listing — the Chinese-ADR exclusion does not apply. The exposure is real and deteriorating: JV volume fell to 1.88m units (7.1% share, from 8.4% in 2023), and 2025 carried further restructuring in a "market with significant excess capacity" [3].
The other exclusion screens are clean. GM is not a promotional-CEO case (X2): management broke two expensive strategic promises — the EV-profitability ramp and Cruise robotaxi — but delivered its core-auto guidance and named the problems before analysts did, so the pattern is mixed execution, not quarterly-EPS management. It is not a mechanical structural-decline case (X3): revenue shows a single −2.1% year in FY2025, not three consecutive high-single-digit declines. And it is not a consensus darling (X4): GM trades near 0.5x sales and ~6x forward earnings — the exclusion fails in the cheap direction, not the expensive one.
Universe — passed. Geography: a US-primary NYSE listing, Delaware-incorporated, ticker GM — not a foreign or Chinese ADR [4]. Market cap: ~$87.9B (973M shares × $90.30 on 2026-07-28), roughly 8.8x the framework's $10B floor.
Market cap is derived: 973M diluted shares (FY2025) × $90.30 close (2026-07-28); share count from company filings [5].
Pattern match
GM fits none of the framework's four recognition setups cleanly. It is not a large bank at a cyclical bottom (pattern 1 is banks only). It is not a high-dividend-plus-high-FCF-yield case — the dividend yields under 0.8% and no part of the return leans on it (pattern 2). It is not a healthcare/insurance forecasting error (pattern 3). And it is not a quality tech monopoly on a fear dip (pattern 4).
The one genuine resemblance is structural, not categorical: the 2025 dislocation was a whole-industry tariff shock, the kind of industry-wide repricing the framework prizes because mean reversion is structural rather than company-specific. That shape is what makes the dislocation and yield pillars pass on arithmetic. It does not rescue the fit, because the car-company exclusion and the year-10 gate govern, and both cut the other way.
The pillar ledger
Source: deterministic fit tally; verdicts and aggregates as recorded — reference lines, not scores.
Year-10 durability — the gate that fails (P1: not met; probability 0.495, spread 0.10)
The gate asks whether year-10 revenue and free cash flow will be higher than today, with very high conviction. Revenue higher in a decade is plausible — GM grew from $109B (2020) to $168B (2025) and gains US share. Adjusted free cash flow higher with very high conviction is not available, because the variables that decide it sit largely outside GM's control and currently cut against it: EV-transition timing (GM took $7.9B of GMNA realignment charges in 2025 after adoption came in slower than planned), a recurring tariff drag of $3.1 billion of EBIT-adjusted in 2025 with $3–4B estimated for 2026 [6], a China equity engine that swung from roughly +$1B to multi-billion losses with the JV agreement expiring in 2027, and a moat confined to one truck franchise. The four jurors agreed (cross-family) at a mean probability of 0.495 — a coin toss where the gate demands near-certainty. Any proper doubt resolves the binary gate to does not fit. This is the reference line GM cannot reach, and it decides the report.
The strongest surviving counter-fact: GM has produced positive free cash flow every year from 2016 through 2025, is retiring float aggressively, and guides to 2026 net income of $10.3–11.7 billion and EBIT-adjusted of $13.0–15.0 billion — normalized earning power well above the charge-depressed 2025 result [7]. Earning power is not the question; ten-year conviction is, and it is not there. Full treatment on the Durability tab.
Consistency — contested (P2)
Reported free cash flow was positive in all ten years FY2016–FY2025, ranging $6.5B to $17.6B, with the rolling five-year average rising from ~$8.5B to ~$10.3B — volatile year to year but not unpredictable [8]. On that reading, the consistency bar is met. The contest is over the basis: the framework's yield is adjusted FCF (after SBC and acquisitions), and the deterministic stability feature returned not_computable because the pipeline flagged share-based compensation as missing for every year. SBC is in fact disclosed in the statements of equity ($531M/$543M/$253M for 2025/2024/2023) [9], so the series can be reconstructed — but the source-of-record feature does not compute it. The jury split cleanly across families on exactly this point (see Contested and undetermined below). Full treatment on the Yield and Durability tabs.
Dislocation and yield — the pillars GM passes (P3a met; P3b not met; P3c met; P3d met, probability 0.855, spread 0.01)
The dislocation was real and dated: GM fell 29.4% from a $60.20 close (25 Nov 2024) to $42.48 (8 Apr 2025), triggered by the 25% imported-vehicle tariff, which GM matched with an EBIT-adjusted guidance cut to $10.0–12.5B from $13.7–15.7B [10]. So P3a is met. But the fear gauge is not: traded volume through the fall spiked only ~1.6x the trailing median — orderly repricing, not the 60–70% forced-selling capitulation the framework requires at a peak-fear moment. So P3b is not met, and the entry trigger is no longer live: at $90.30 GM sits ~50% above the pre-fall peak, the drawdown fully reversed.
On valuation the arithmetic passes. GM's adjusted-FCF yield clears the 10% default bar on every reasonable basis — ~13.5% on three-year-average adjusted FCF, ~12.1% on FY2025 automotive FCF, and ~11.0% on the most conservative anchor, consensus forward FCF — so P3c is met. The counter-fact travels with it: the ~19% headline yield on reported FCF overstates the case, because 2025's $17.6B was lifted by a ~$9.1B working-capital release and blends in GM Financial's cash flows [11]. Forward, consensus FCF clears the bar every year FY2025–FY2028 (~11.0% rising to ~13.6%), so no mean-reversion underwrite is needed; the jury put this at probability 0.855 with a spread of just 0.01. The framework's own caution applies squarely here: a car company screening cheap on FCF yield is its canonical value trap, so a passing yield is the signature it distrusts, not a fit. Full treatment on the Dislocation and Yield tabs.
Source: consensus FCF (CapIQ) on the $87.9B market cap; the 10% line is the framework's default balance-sheet bar. Derived from company filings and consensus estimates [12].
Balance sheet and self-help — passed (P4a met; P4b met; P4c not applicable)
On an industrial basis GM is net cash: automotive liquidity of ~$35.7B against ~$16.2B of automotive debt, with only $663M due in 2026 — capital allocation is not forced toward debt paydown, so P4a is met [13]. The counter-fact sits alongside it: consolidated debt is ~$130B, of which $114B is GM Financial's captive-finance book, market-funded and matched against ~$123B of finance receivables and leases — non-recourse to automotive, but it does make a consolidated leverage figure hard to read [14].
The buyback engine is executed, not promised: GM spent $11.1B/$7.1B/$6.0B on repurchases in 2023–2025 and retired roughly 35% of its shares since late 2023 at a blended ~$49, well below today's $90.30; the diluted count fell from 1,570M (2016) to 973M (2025), a 38% reduction [15]. The framework's hard-fail — a rising share count from SBC or serial M&A — is absent, so P4b is met; the only offset is that GM paused repurchases in Q1 2025 when tariffs hit, confirming buybacks yield to liquidity under stress [16]. The dividend is immaterial (P4c not applicable): under 0.8% yield, covered many times, and no part of the return leans on it. Full treatment on the Self-Help tab.
Diagnosis — a moderate lean, not a settled call (P5: met, probability 0.63, spread 0.22)
The blind adversarial trial set the probability that the impairment is temporary at 0.63, with a per-judge range of 0.44–0.66 and a spread of 0.22 — a moderate lean toward temporary, reflecting a discrete, fading EV/tariff hit, not a consensus. The dissent matters: one permanent-first judge sat at 0.44, weighing the permanent China and Cruise write-offs, and the report cannot override the ruling. The price-vs-value gap the framework hunts existed only briefly at the April 2025 trough and has since closed and reversed — market cap is ~$88B, roughly $20B above the pre-event peak. Full treatment on the Damage Math tab.
Instrument context — a fact GM meets (I1: not verifiable in-corpus)
Long-dated listed options exist on GM (LEAPS to January 2028) and 30-day implied volatility was ~38% on 2026-07-28, below the framework's ~50–55 reference line — so on instrument grounds the name would not be routed to watchlist-only. The verdict is recorded as not verifiable because these facts are web-sourced; the corpus and local structured feeds carry no citable option expiries, open interest, or implied-volatility series. Stated as a framework fact, never as advice. Full treatment on the Clock tab.
What a 3x-in-3-years would require
The framework's target test — the price at the bar yield on normalized adjusted FCF, and what consensus would have to concede — does not compute here. Re-rating math is unavailable because the applicable bar or normalized adjusted FCF is missing: the deterministic adjusted-FCF series is not_computable (the SBC pipeline gap above), so no normalized adjusted-FCF anchor or implied market cap at the bar can be set without substituting an improvised figure.
What can be said in arithmetic points the other way from a fresh entry. The yield already clears the 10% bar (~11.0–13.6% forward), and the buyback flywheel is live, so the cash-return mechanics are present — but the stock trades at an all-time high with the dislocation fully reversed, so there is no fear discount to re-rate off. For base-rate context, the Clock tab records four GM drawdowns of 35–64% since 2011, each fully recovered, with trough-to-recovery running 10–23 months (centered near 18) and full round trips of 2.9–3.8 years. Those episodes describe what a future trough entry might return; none is available today, and the year-10 gate closes the case regardless.
Contested and undetermined
Contested — P2 (FCF consistency). Both readings are on the table, and the jury split across model families. The two Claude-family seats read P2 as met on reported FCF (positive every year FY2016–FY2025, rising five-year average). The two Codex-family seats read it as cannot determine, because the deterministic adjusted-FCF stability feature is not_computable — adjusted FCF lacks the pipeline SBC needed for a rolling five-year adjusted series. The masked probe resolved this to "met." The disagreement is exactly cross-family (a=met, b=met / c=cannot_determine, d=cannot_determine), which is why the tally records P2 as contested rather than resolved. The honest statement: on reported FCF the consistency bar is met; on the framework's own adjusted basis it cannot be confirmed from the source of record.
Undetermined — I1 (instrument context). Recorded as not verifiable: options and implied-volatility facts exist only in web data, with no corpus or structured-feed source to pin option expiries, open interest, or the exact IV figure. No criterion resolved to cannot determine at the criterion level.
Provenance
| Dimension | Result |
|---|---|
| Jury families | Claude, Codex (two seats each: a, b = Claude; c, d = Codex; masked = Claude) |
| Cross-family agreement | Every gate criterion agreed across families; P2 is the sole cross-family split |
| Order stability | temporary-first mean 0.63, permanent-first mean 0.55, gap 0.08 |
| Name-mask probe | max probability gap 0.005; no gate criterion changed under masking (prior_driven_risk: false) |
| Skeptic checks | 22 fully checked — 15 survived, 5 weakened, 1 refuted, 1 unverifiable (plus 22 cheap-triaged) |
Source: deterministic fit tally and skeptic ledger.
The verdict was pressed hard and did not move. Two independent model families ran the checklist blind; they agreed on the P1 gate and every other gate criterion, disagreeing only on how to classify P2's not_computable feature — and a name-masked re-run shifted no gate and moved probabilities by at most half a point, so the result is not an artifact of GM's identity. One skeptic check was refuted outright: a claim that the 2025 EV charge was largely non-cash failed against the Q2 FY2026 10-Q, which shows the $7.9B charge was $3.2B non-cash and $4.7B cash-related — that finding is excluded from the support here.
The falsifier ledger
These are the standing what-would-change-this conditions. The first five are the framework's own templates; the rest are the name-specific thresholds and windows from the diagnosis.
- adjusted FCF or EBITDA declines where flat-or-better was underwritten
- revenue declines for a third consecutive year
- capital allocation pivots to debt paydown over repurchases
- share count inflects upward
- the industry repricing cycle fails to materialize where industry-wide mean reversion was underwritten
- FY2026 EBIT-adjusted lands below ~$13B or auto FCF below ~$9B, showing the core earning-power level itself, not just optics, has stepped down.
- Material new EV/regulatory charges land in 2026 beyond 'substantially completed' (the 10-K already flags 'additional charges'), proving the write-off was a floor not a ceiling.
- GMNA EBIT-adjusted margin stays structurally sub-7% rather than recovering toward 8-9%, making the tariff/mix compression permanent.
- China keeps bleeding with further restructuring and no recovery in equity income above ~$1B.
- FY2026 and FY2027 adjusted EBIT and adjusted automotive free cash flow meet or exceed guidance after special items, with EV charges ending and no new capacity or supply-contract write-downs.
- Annual tariff EBIT impact falls below $1B or is fully offset without price, mix, volume, or footprint impairment.
- China JVs return to sustained profitability and market-share recovery with no further restructuring or impairment charges.
- GM discloses profitable EV, personal autonomy, or software growth sufficient to replace the abandoned EV capacity and Cruise robotaxi option value.
- FY2026 actuals miss the $13-15B EBIT-adjusted / $9-11B auto FCF guidance materially (results by Jan 2027), showing the rebound was cosmetic.
- North America EBIT-adjusted margin compresses structurally and durably below ~6%, signaling the truck/SUV franchise itself — not just EVs — is eroding.
- New EV or restructuring charges recur beyond the 'substantially completed' figure into 2027, proving the write-off was a floor not a ceiling.
- Net tariff EBIT impact re-expands past $5B on a structural basis despite the IEEPA reversal and refunds.
Data gaps
What the run could not answer:
- Adjusted-FCF series (the framework's yield basis). fit_features.adjusted_fcf and fcf_stability returned not_computable because the pipeline flagged SBC as missing for FY2016–FY2025. SBC is in fact disclosed in the statements of equity and was reconstructed for the reported-basis reads; the feature should not be treated as a genuine absence of the data. Acquisitions are correctly zero (GM discloses no business-acquisition cash line).
- Balance-sheet class. fit_features.balance_sheet_class returned unknown (FY2025 net-debt/EBITDA unresolved); established directly from Note 13 — automotive net cash on an industrial basis, with GM Financial's ~$114B treated as matched-funded captive debt.
- Live consensus positioning. A dated forward-P/E, rating distribution, and price-target refresh could not be pulled from the pipeline; figures rest on a single July-2026 WebSearch snapshot, not a corpus source.
- Fear-gauge and flow detail. Reported short-interest is unavailable (feed status "unavailable," zero history rows), and no holder-by-holder or forced-seller evidence surfaced for the drawdown window.
- Instrument facts. Precise current option open interest/liquidity was not verifiable from a citable dated source; the IV level relies on a single third-party source (AlphaQuery, 2026-07-28) without primary or two-source corroboration.
- Forward path and stress record. Consensus FY2029 FCF is not disclosed by the vendor, truncating the forward-yield path at FY2028; and the current entity (incorporated 2009) has no free-cash-flow record through a credit-driven recession.
General Motors — what it is, and whether it belongs in the universe
General Motors is a car company — a direct hit on the framework's auto-OEM exclusion, the value trap this reader has paid for before. The universe screens pass cleanly: a primary NYSE listing and a roughly $88 billion market cap, about nine times the $10 billion line. Its market structure is a fiercely competitive global oligopoly with chronic excess manufacturing capacity and no pricing moat, and its China business has turned from profit engine into an equity-method drag.
The universe screen
GM's common stock is registered under Section 12(b) and lists on the New York Stock Exchange under the symbol GM; the company was incorporated as a Delaware corporation in 2009 and is headquartered in Detroit [1]. This is a domestic US primary listing — not a European ADR, not a Chinese ADR — so the geography test (U1) is met without qualification.
Market Cap ($B)
Market cap derived from 973 million shares outstanding (FY2025) at the $90.30 close of 2026-07-28; share count per the FY2025 10-K income statement [2].
At $90.30 (2026-07-28) on about 973 million shares, GM is worth roughly $87.9 billion — comfortably clear of the $10 billion floor (U2 met). The market-cap test passes by a wide margin; the exclusion checks below are where GM's fit is decided.
What the business is
GM designs, builds and sells trucks, crossovers, cars and parts, and provides automotive financing. It runs three reportable segments: GM North America (GMNA), its profit engine; GM International (GMI); and GM Financial, its captive lender. Vehicles carry the Buick, Cadillac, Chevrolet and GMC brands, and GM leads the US industry in sales [3]. FY2025 revenue was $167.97 billion, and the company employed roughly 156,000 people — about 88,000 hourly (56%) and 68,000 salaried (44%), with about 47,000 US hourly workers represented by the UAW [4].
Source: FY2025 Annual Report (Form 10-K), Consolidated Income Statements [5]; prior-year figures from reported financials.
Two things stand out from the eight-year record, and both matter to later tabs. Revenue has been range-bound between roughly $109 billion and $172 billion — cyclical, not growing structurally — and FY2025 net income of $2.7 billion collapsed from $6.0 billion in 2024 and $10.1 billion in 2023. The revenue line is stable-to-cyclical; the earnings line is where the recent damage sits, and the anatomy of that fall belongs to the Dislocation and Damage Math tabs, not here.
Segment economics — one engine carries the company
Roughly 87% of GM's vehicle sales are North American, and North America produces almost all of the profit. GMNA generated $10.5 billion of EBIT-adjusted on $154.3 billion of revenue in FY2025 — but that was down 28% from $14.5 billion in 2024, a 6.8% margin against management's stated 8–10% target, with roughly $3.1 billion of tariff cost cited as the swing factor [6]. GMI is small — $13.4 billion of revenue and $0.7 billion of EBIT-adjusted — and GM Financial contributed $2.8 billion of EBIT [7][8].
Source: FY2025 Annual Report (Form 10-K), MD&A segment results [9][10][11]. GM Financial shown at EBIT; segment revenues do not sum to consolidated revenue because of intersegment eliminations.
The economic reality is concentrated: full-size pickups and SUVs sold in the United States and financed through GM Financial. GMI, outside China, is a rounding error against GMNA, and GM's China exposure runs through equity-method joint ventures that sit outside these revenue lines (below).
Market structure — the durability raw material
This is the evidence the Durability tab and the jury lean on, so it is laid out plainly. The US light-vehicle market is a consolidated oligopoly in which GM is the share leader, but leadership is thin and contested, and the industry's own economics work against pricing power.
GM's 17.2% US share (2.85m of 16.6m units) per the FY2025 10-K [12]; competitor US units and shares from the indexed peer filings and industry sales data [13]. Competitor shares are approximate.
Four points, each cited, that a durability jury needs:
It competes on everything except price power. GM's own 10-K describes an industry "characterized by intense competition, evolving regulatory requirements, changing consumer expectations" that "is highly competitive in terms of the quality, innovation, new technologies, pricing, fuel economy, reliability, safety, customer service, and financial services" — an industry that "has historically had excess manufacturing capacity," where "attempts by our competitors to sell more vehicles could have a significant negative effect" on GM's pricing and share [14]. Chronic overcapacity and price-based competition are the antithesis of a monopoly's margin protection.
Share leadership is narrow. GM's 17.2% US share sits barely ahead of Toyota (~15%) and Ford (~13%), with Hyundai-Kia, Honda, Stellantis and Tesla all live in the same market [15]. This is not a duopoly with pricing discipline; it is a seven-way scramble. GM's strength is concentrated in one franchise — US full-size trucks, where it holds about 33% share — not in cars, where its US share fell to roughly 2% [16].
Capital intensity is real, but it is not a moat. GM runs 50 US manufacturing and parts facilities across 19 states, including 11 assembly plants, and announced about $4.0 billion to onshore additional production [17]. Under this framework, capital heft protects an essential if the industry is not oversupplied; here the same 10-K concedes historical excess capacity, so the capital base is a cost to defend, not a barrier that keeps rivals out [18].
Long operating history, discontinuous legal entity. GM has more than a century of brand history but the filing entity was incorporated only in 2009, out of the predecessor's bankruptcy reorganization [19]. The franchise is old; the balance sheet and the going concern are the post-2009 company. Product is essential (personal transportation) and demand is durable; what is not durable is any single automaker's share of it.
Exclusion screen — the checks the corpus settles here
Auto-OEM exclusion (X1): GM is a motor-vehicle manufacturer (SEC SIC 3711). Car companies are a named hard exclusion in this framework — "too competitive, undifferentiated, excess capacity … screen cheap on FCF yield and never create long-term shareholder wealth." GM's own 10-K supplies the excess-capacity and price-competition evidence that defines the exclusion.
X1 — auto-OEM: a direct hit. GM is exactly the kind of business the framework excludes by name, and does so because these names look cheap on cash-flow yield yet do not compound owner value. GM's FY2025 filing supplies the confirming facts in its own words: a highly competitive industry with historical excess manufacturing capacity, competing on price [20]. This is stated here, plainly, and carried to Fit; it is not softened.
X4 — consensus darling: not a hit. The exclusion of over-owned, extreme-multiple darlings does not fit GM. It trades at roughly 0.5x sales ($87.9 billion market cap on $167.97 billion revenue [21]) and at about a 6x forward earnings multiple against an industry near 20x (consensus data, July 2026) — the profile of an out-of-favor cyclical, not a story stock on a bottom-left-to-top-right chart. The counter-fact, stated fairly: the sell side is not bearish — the average rating is a "Buy" with targets around $100–105 (consensus, July 2026) — so the setup is cheapness the market dislikes owning, not fear the sell side shares. GM is not a darling; whether it is a deserved cheapness is the value-trap question X1 raises and the later tabs test.
S1 — China dependence: material, and now a drag. GM's China business runs through equity-method joint ventures (SAIC-GM/SGM and SAIC-GM-Wuling/SGMW) whose vehicle sales are not recorded in GM's revenue; only GM's share of their results flows through equity income [22]. Those JVs sold 1.88 million units for a 7.1% China share in 2025 (down from 8.4% in 2023) and generated an equity loss of $0.3 billion, including $0.6 billion of SGM restructuring charges [23]. So China is a real sensitivity — a large unit base and a genuine restructuring cost — but it is off-balance-sheet earnings, a shrinking share, and currently a loss rather than a profit pillar. It is flagged, not exclusionary; the listing itself is US, so the Chinese-ADR exclusion does not apply.
Promotional-CEO (X2) and structural-decline (X3) belong to Self-Help and Durability; nothing in the business overview forces either call, and neither is duplicated here.
Dislocation
GM's drawdown was real, dated, and shallow by this framework's standard: −29.4% from a $60.20 peak on 25 November 2024 to a $42.48 trough on 8 April 2025, triggered by a 25% auto-import tariff and a matching guidance cut. Traded volume rose only 1.60x through the fall — orderly repricing, not capitulation. At $90.30 today the stock sits ~50% above that peak and ~113% above the trough. The framework's entry condition — fear repricing the stock now — is absent.
The drawdown, quantified
Peak (25 Nov 2024)
Trough (8 Apr 2025)
Peak-to-Trough Depth
Current (28 Jul 2026)
Source: fit_features.capitulation_gauge.drawdown, derived from the daily price feed; peak, trough and current are closing prices.
The fall ran from a $60.20 close on 25 November 2024 to a $42.48 close on 8 April 2025 — 134 days, a −29.4% peak-to-trough move. It came in two legs. The first was a drawn-out slide of roughly −20% from the November peak into early February, punctuated by the 28 January 2025 fourth-quarter print: the stock closed down 8.9% that day (from $54.92 to $50.04) on 33.8 million shares — its heaviest day of the episode — despite a revenue beat, as management paired a cautious 2025 outlook with a $4.1 billion special charge on its China joint venture [1]. The stock then recovered to $50.95 by 26 March before the second, sharper leg.
Source: daily price feed, month-end closes; the $60.20 peak (25 Nov 2024) and $42.48 trough (8 Apr 2025) are intramonth daily closes per fit_features.capitulation_gauge.drawdown.
The chart's right half is the point for this framework. The trough held for a matter of weeks; by July 2025 the stock was back above $52, it cleared the old $60 peak by September 2025, and it closed at $90.30 on 28 July 2026 — up ~113% from the trough and ~50% above the pre-drawdown peak. The dislocation this tab describes is fifteen months in the past and has fully reversed.
The trigger
The event leg is separable from the earlier drift and carries a dated cause. On 26 March 2025 a 25% tariff on imported vehicles was announced (effective 3 April), followed by the 2 April reciprocal-tariff action; GM closed at $50.95 on 26 March and bottomed at $42.48 on 8 April — a −16.6% event leg concentrated in nine trading days. GM confirmed the mechanism in its own numbers: on its Q1 2025 call it cut full-year EBIT-adjusted guidance to $10.0–$12.5 billion "including a current tariff exposure of $4 billion to $5 billion" [2]. That replaced the $13.7–$15.7 billion EBIT-adjusted, $11–$12 EPS and $11–$13 billion automotive-free-cash-flow guidance issued in January, which had explicitly excluded any tariff impact [3].
The trigger is therefore documented and specific: an industry-wide cost shock repriced across the sector, matched almost move-for-move by GM's guidance. It is the kind of whole-industry forecasting shock the framework treats as a strong setup — but here the market's reaction and the earnings reset moved together rather than the price outrunning the cut (see estimates vs. price timing below), and the realized damage came in below the initial fear. The FY2025 10-K records an actual $3.1 billion EBIT-adjusted tariff hit for 2025, with a $3.0–$4.0 billion range estimated for 2026 [4]. Whether that hit is temporary or permanent belongs to the Damage Math tab; this tab records only that a real, dated event caused the fall.
The fear gauge
Volume Spike (× trailing median)
Heaviest Single Day (M shares)
Source: fit_features.capitulation_gauge.volume_spike (max 20-day average volume in the peak-to-trough leg ÷ median daily volume over the 180 days before the peak); heaviest day is 28 Jan 2025 from the daily feed.
The measured spike is 1.60x — the busiest 20-day stretch of the fall ran at 1.60 times the pre-peak median daily volume. That is elevated, not extreme. The heaviest single sessions clustered on the 28 January earnings day (33.8 million shares) and the tariff low of early April (26.7 million on 4 April, 25.5 million on 7 April), against a pre-peak median near 13–14 million. A 1.60x reading describes orderly repricing of a known cost shock, not the emotion-driven, forced selling the framework looks for at a peak-fear moment. On its own terms, this is a repricing the market absorbed without panic.
Who was selling
Reported short-interest data is unavailable for GM in this run — the official/public short-interest feed returned no rows, so the level and change through the fall cannot be quantified here.
What the record does show is the identity of the largest single buyer through and after the drawdown: GM itself. The company returned roughly 55% of its $14 billion of 2024 automotive free cash flow, about $7.6 billion, and repurchased 87 million shares in the open market in Q4 2024 alone at an average of $53.84, ending 2024 below one billion shares [5]. Buybacks continued at $6.0 billion in FY2025, and the diluted share count fell from 1,129 million (FY2024) to 973 million (FY2025) — a −13.8% reduction in a single year. No forced or structural sellers (index exits, fund liquidations, disclosed insider dumping) surface in the corpus. The dominant flow, on the evidence available, ran toward the company retiring stock into weakness rather than anchored holders capitulating out of it.
Buyback and share-count figures: fit_features.share_count_trend, derived from company filings.
Estimates versus price timing
The framework's signature setup is a price fall that outruns the estimate cut. GM's did not. Consensus and price fell together on the same tariff news: the guidance midpoint dropped from ~$14.7 billion to ~$11.25 billion of EBIT-adjusted — a ~24% cut reflecting a genuine $4–$5 billion exposure [6] — against a −29.4% peak-to-trough price move. Roughly one-for-one: the market marked the stock down about as much as the earnings guide came down. There is no gap here of the kind that signals mispricing at the trough.
Both then recovered. Current consensus forward free cash flow runs at about $9.65 billion for FY2025 (≈11.0% on today's $87.9 billion market cap), rising to ~$11.65 billion by FY2027 (≈13.3%), per fit_features.consensus_forward_yield. The realized 2025 tariff hit ($3.1 billion) landed below the $4–$5 billion initially feared [7]. Estimates that fell with the price have since risen alongside it, and the price has risen further.
What this establishes
There was a real, dated dislocation — a −29.4% tariff-driven drawdown from November 2024 to April 2025 — but it is not a live one. The depth was shallow relative to the 60–70% falls this framework hunts, the 1.60x volume spike fell short of capitulation, the price move tracked the guidance cut roughly one-for-one rather than outrunning it, and the whole move has since reversed to leave the stock ~50% above its pre-drawdown peak. The entry condition the framework requires — fear repricing the stock now — is not present at $90.30. How that reads against the full pillar test, including the car-industry exclusion, is settled on the Fit tab.
Damage Math
GM's reported profit collapsed in 2025 — net income fell from $6.0 billion to $2.7 billion and diluted EPS from $6.37 to $3.27 [1]. But the fall was a discrete $7.9 billion EV write-off plus tariffs, not a cut to recurring earning power: adjusted EPS held near $10.60 and is guided to $11–13 for 2026 [2]. The ~29% drawdown has fully reversed; at $90.30 the stock trades ~50% above its pre-event peak. The damage-gap Ruchir hunts has closed.
The near-term hit, quantified
The 2025 hit lived almost entirely on the GAAP line. Reported net income to stockholders dropped to $2.7 billion, its lowest since the pandemic year, and diluted EPS to $3.27 [3]. The single largest driver was the EV strategic realignment: GM recorded $7.9 billion of charges in GMNA in 2025 — $3.2 billion of non-cash impairment plus cash settlement charges — writing down EV-related tooling and equipment to nominal salvage value [4]. The second was tariffs, which compressed the North America profit engine: GMNA EBIT-adjusted fell to $10,452 million from $14,528 million, a margin of 6.8% versus 9.2% [5].
FY2025 net income ($M)
▲ $6,008 FY2024
FY2025 GAAP EPS
▲ $6.37 FY2024
2025 EV charge ($B)
FY2025 adjusted EPS
Sources: FY2025 10-K, Consolidated Income Statements [6]; Q2 FY2026 10-Q, segment note [7]; adjusted EPS from consensus (CapIQ).
Source: FY2021–FY2025 10-K Consolidated Income Statements, as reported [8].
The gap between the reported and the underlying number is where the damage math turns. GM entered 2025 guiding EBIT-adjusted of $13.7–15.7 billion, EPS-diluted-adjusted of $11–12, and adjusted automotive free cash flow of $11–13 billion [9]. In April 2025 it cut EBIT-adjusted to $10–12.5 billion, naming a current tariff exposure of $4–5 billion [10]. That is the near-term numerator: a roughly $3.5 billion midpoint cut to one year's operating profit, tariff-driven. GM then delivered $12.7 billion of EBIT-adjusted for 2025 — above the top of that revised range and down only 15% from the 2024 record of $14.9 billion [11]. The recurring earning power did not step down with it — adjusted EPS came in near $10.60, and for 2026 GM guides EBIT-adjusted back to $13–15 billion, adjusted EPS $11–13, and adjusted automotive free cash flow $9–11 billion [12].
| Metric | FY2025 guide (Jan 2025) | Revised (Apr 2025) | FY2025 actual | FY2026 guide (Jan 2026) |
|---|---|---|---|---|
| EBIT-adjusted | $13.7–15.7B | $10.0–12.5B | $12.7B (actual) | $13–15B |
| Adjusted EPS | $11–12 | — | ~$10.60 | $11–13 |
| Adjusted auto FCF | $11–13B | — | — | $9–11B |
| Reported net income | — | — | $2.7B | — |
Sources: Q4 FY2024 call [13]; Q1 FY2025 call [14]; Q4 FY2025 call [15]; FY2025 10-K [16].
Consensus tells the same story from the sell side: normalized EPS of $10.60 for FY2025 rises to $13.36 (FY2026) and $14.67 (FY2027), and consensus free cash flow clears $9.9–11.7 billion across FY2026–27 — a rising, not a cut, trajectory. This is the feature that breaks the Centene analogy: there, EPS was cut by two-thirds; here, the reported number fell by half while the underwritable number was flat and is climbing.
The price change over the same window
The market's reaction was a genuine drawdown, but a shallow one by Ruchir's standard, and it is long gone. GM peaked at $60.20 on 25 November 2024, troughed at $42.48 on 8 April 2025 — a 29.4% fall over 134 days — and now trades at $90.30, a full recovery charted below. The volume signature was modest: the peak-to-trough leg carried only a 1.6x volume spike over the prior six-month median — pressure, not the emotion-driven capitulation the framework's fear gauge looks for.
Source: daily price history (month-end closes); intramonth peak $60.20 (25 Nov 2024) and trough $42.48 (8 Apr 2025) per the capitulation gauge — derived from fit_features.capitulation_gauge.
The two moves belong side by side. Reported EPS fell about 49% in 2025; adjusted EPS fell roughly 10% against the original guide and was flat year-on-year; peak-to-trough market value fell about 29% — roughly $21 billion, from a ~$68 billion peak to ~$47 billion at the low. Since then the market cap has risen to $87.9 billion — up about $41 billion from the trough and about $20 billion above the pre-event peak. GM's automotive book runs roughly net cash — consensus net cash of about $7.5 billion — so market cap is a fair proxy for automotive enterprise value; the drawdown and recovery are an equity-value story, not a leverage one.
The NPV arithmetic, conservatively
The question the framework asks: under conservative assumptions, how much of the NPV of future cash flows could this hit plausibly destroy, and how does that compare with what the price destroyed? A transparent, no-growth model answers it. Normalized adjusted automotive FCF post-event is about $10 billion (2026 guide midpoint, and consistent with $9.3–10.0 billion reported in 2023–24). Pre-event, GM delivered $14 billion of adjusted automotive FCF in 2024 and guided $11–13 billion for 2025, so the durable level shift the problem introduced is bounded at roughly $2 billion per year (central) to $4 billion per year (against the record year). Discount at 10% — a fair cost of equity for a cyclical automaker — with no perpetual growth.
Source: two-scenario DCF-lite; annual hit and $10B normalized FCF base from FY2024–FY2026 guidance [17] [18]; discount rate 10%, zero growth — computed, workings in text.
The workings are on the page: a temporary hit of $2 billion for three years discounted at 10% is $2B × 2.487 = $5.0 billion of NPV; at $4 billion it is $9.9 billion. A permanent $2 billion level shift is $2B ÷ 0.10 = $20 billion; at $4 billion it is $40 billion. Against the ~$21 billion of market value that actually evaporated peak-to-trough, these NPV losses bracket the reading. At the April 2025 low, the price damage sat at the low end of the permanent range and roughly four times the central temporary case — the market was pricing the hit as essentially permanent. That was the moment the framework's setup could have been live.
Bottom line on the gap: it existed only briefly, and it has closed. Peak-to-trough, about $21 billion of value was destroyed against a temporary-scenario NPV loss of $5–10 billion — a potential $11–16 billion of over-punishment at the April 2025 trough. Fifteen months later the market cap is $87.9 billion, roughly $20 billion above the pre-event peak. The price has not merely caught up to a temporary reading of the damage; it has moved above where it began. There is no current gap between price damage and plausible value damage to exploit.
At $90.30, consensus forward free cash flow of about $9.9 billion is an 11.3% yield on the current market cap — above Ruchir's 10% moderate-balance-sheet bar, as the Yield tab computes. But the yield is being earned with the fear already gone and the price above its starting point, not at a moment of maximum dislocation — the entry trigger the Dislocation tab tests is no longer live.
The trial — temporary or permanent, presented fairly
Whether the impairment is temporary or permanent was tried by two opposing corpus-cited briefs and ruled on by independent blind judges. Both cases are strong.
The temporary case at its strongest. The 2025 collapse was a discrete, largely non-cash write-off, not lost profitability: the impairment "include[s] the cost of writing down EV-related tooling and equipment to its nominal salvage value," and cash outflow in 2025 was only $400 million [19]. GM states it has "substantially completed the recognition of material cash charges related to our EV strategic realignment" [20] — a terminating charge is the definition of a temporary earnings effect. The retail truck/SUV franchise was untouched, 2026 guidance is back to record-adjacent levels [21], and tariffs — a policy variable — are already partly reversed, with the net 2026 EBIT-adjusted impact guided to $2.5–3.5 billion after a $0.5 billion IEEPA refund [22].
The permanent case at its strongest. A higher adjusted year can coexist with lower NPV when it is achieved by abandoning projects and leaning on mature profit pools. Tariffs reset the cost base — GM "do[es] not expect such actions to fully offset the impact of tariffs in the near term" [23], and the impact recurs at $2.5–3.5 billion into 2026 [24]. The EV assets were written down, not delayed, with a further $3.4 billion of net charges in H1 2026 and additional charges still expected [25]. China was impaired as an "other-than-temporary" loss in value [26], and Cruise's robotaxi option was wound down entirely [27]. The remaining profit pool is more mature and price-sensitive, resting on full-size ICE trucks in a market where incentives may yield "vehicle prices that do not offset our costs" [28].
The ruling. The judges put the probability the impairment is temporary at 0.63, with a per-judge range of 0.44–0.66 and a spread of 0.22 — not flagged contested, but not a consensus either: one judge (reading the permanent brief first) landed at 0.44, leaning the other way. Order stability was reasonable (temporary-first mean 0.63 versus permanent-first mean 0.55, an 0.08 gap). The read the report carries is a moderate lean toward temporary — the discrete EV charge and the fading, partly-refunded tariff both wind down — tempered by the genuinely permanent pieces (China marked other-than-temporary, Cruise exited) that lower NPV regardless of the adjusted-EPS rebound. This diagnosis probability is the trial's, and it stands as the report's; the analysis here only names the drivers.
Which line broke, and whether it self-corrects
Four drivers broke; they do not self-correct at the same rate.
EV realignment is the largest and the most self-correcting: $7.9 billion in 2025 was mostly a non-cash write-down of tooling to salvage plus one-time supplier/JV settlements, and GM calls the material cash charges substantially completed [29] — though it still expects some additional charges, and $3.4 billion more landed in H1 2026 [30].
Tariffs are a policy cost, not a structural one: net 2026 impact of $2.5–3.5 billion after mitigation and a $0.5 billion IEEPA refund [31], fading from the $4–5 billion gross exposure named in early 2025 [32]. It reprices as trade policy settles, but GM concedes mitigation will not fully offset it near-term [33].
China and Cruise are the pieces that do not come back on their own: the China equity interests were impaired as an other-than-temporary loss in value [34], and the Cruise robotaxi option was wound down rather than paused [35]. Their recovery would require new growth GM has not yet disclosed, and their loss is why the 2026 rebound rests more heavily on the mature full-size ICE franchise [36] — a narrower base whose durability the Durability tab weighs.
Yield
General Motors clears the framework's adjusted-FCF yield bar on every reasonable basis: the 3-year average adjusted FCF computes to roughly 13.5% on today's $87.9B market cap, GM's own automotive free cash flow to about 12%, and consensus forward FCF to 11.0%–13.6% through 2028 — all above the 10% default line. The subtlety is what "reported FCF" means for an automaker that consolidates a $114B finance book, and that the framework treats a car company screening cheap on FCF yield as a value-trap signature, not a dislocation.
The adjustment, line by line
The framework's yield basis is adjusted FCF: reported free cash flow, minus stock-based compensation, minus the trailing five-year average of acquisition spend. For GM two of those three terms are small. The company discloses no business-acquisition line in its consolidated statement of cash flows — its 2025 purchase of the Cruise noncontrolling interests was an equity transaction, not an asset buy [1] — so the five-year average acquisition adjustment is zero. Stock-based compensation runs $0.3–0.6B a year, a rounding item against $7–18B of FCF [2].
Adjusted FCF = reported FCF − SBC − 5-yr avg acquisition spend; derived from company filings. Reported FCF (operating cash flow − capital expenditures) from the consolidated cash-flow statement [3]; SBC from the statements of equity [4]; FY2020–22 SBC from the FY2022 10-K [5].
The deterministic feature file returned adjusted FCF as not_computable, flagging SBC as missing for all ten years. That is a pipeline artifact, not a real gap: GM does not carry a discrete "stock-based compensation" add-back on its consolidated cash-flow statement — the expense sits in the statements of equity ($541M in FY2025, $552M in FY2024, $259M in FY2023) [6]. The adjustment is reconstructed here from the primary filings and recorded in the data gaps below.
The heavier caveat is the reported-FCF term itself. GM consolidates GM Financial, a captive lender with a $114B debt book, and the FY2025 consolidated operating cash flow of $26.9B was lifted by a $9.1B favorable swing in operating assets and liabilities [7]. So the FY2025 reported FCF of $17.6B — and the ~19% mechanical yield it implies — overstates the sustainable cash the automotive business threw off. GM's own automotive free-cash-flow measure gives the cleaner number.
GM adjusted automotive FCF = automotive operating cash flow − capital expenditures ± management actions, as reported by the company [8].
The yield, three ways
At the July 28, 2026 close of $90.30 and 973M shares, GM's market cap is $87.9B (derived: fit_features.market_cap). Against that, three yield bases converge in a band of roughly 11–16%:
3-yr Avg Adjusted FCF Yield
FY25 Automotive FCF Yield
Consensus FY25 FCF Yield
Yields = FCF ÷ $87.9B market cap. 3-yr average adjusted FCF (FY2023–25) = $11.8B; GM automotive FCF FY2025 = $10.6B [9]; consensus FY2025 FCF = $9.65B (derived: fit_features.consensus_forward_yield).
The current mechanical adjusted yield on FY2025 reported FCF is 19.4% ($17.0B ÷ $87.9B), but that leans on the working-capital-inflated consolidated number and should not be read as the run-rate. The three-year average adjusted FCF of $11.8B — which smooths the FY2025 spike against FY2023's $9.7B and FY2024's $8.7B — computes to 13.5%. GM's own automotive FCF of $10.6B computes to 12.1%. Taking the most conservative anchor available, consensus forward FCF, still lands at 11.0%.
The company's own multi-year yield baseline (fit_features.yield_baseline) is not_computable — the feature pipeline could not reconstruct historical same-year yields. Qualitatively, GM has not shown the fortress "jump" signature the framework hunts for (a stable ~3.5–4% name spiking to 8–9% on a fear scare — Microsoft, Meta). GM has chronically screened cheap on FCF yield for a decade; today's double-digit yield is a continuation of that pattern, not a dislocation away from a calm baseline. That distinction matters, and it cuts against the setup rather than for it.
Which bar applies
The balance-sheet class selects the reference line. The feature file returned balance_sheet_class as unknown (FY2025 debt/EBITDA not resolved); reconstructing from the primary filings shows why the answer is genuinely two-sided for an automaker with a captive finance arm.
Automotive cash + marketable securities $21.7B and total automotive debt $16.2B [10]; consolidated cash $20.9B + marketable securities $6.7B and GM Financial debt $114.0B [11].
On an automotive basis GM carries about $5.5B of net cash — $21.7B of automotive cash and marketable securities against $16.2B of automotive debt, backed by $35.7B of total automotive liquidity [12]. By the framework's mechanical rule (net debt ≤ 0 → fortress), that maps to the 8–9% fortress line. On a consolidated basis GM shows $102.6B of net debt — but $114.0B of that sits at GM Financial, a matched-funded lender whose debt is carried against roughly $123B of finance receivables and leased vehicles [13], not automotive leverage.
The honest reference line here is the 10% default bar, not the 8–9% fortress line: GM's automotive book is net cash, but this is a low-margin, capital-intensive, cyclical automaker, not a net-cash quality compounder of the kind the fortress anchor describes. On that 10% bar, the position in plain arithmetic: 13.5% on the 3-year average adjusted FCF — roughly 350 bps clear; 12.1% on FY2025 automotive FCF — about 210 bps clear; 11.0% on consensus forward FCF — about 100 bps clear. GM sits above the bar on all three, and would clear the lower fortress line by a wider margin still.
Normalized mid-cycle yield
GM is meaningfully cyclical, so the current-year figure needs a normalization check — and here it works in two directions at once. On earnings, FY2025 was depressed: GAAP operating income fell to $2.9B from $12.8B as GM absorbed a $7.9B EV strategic-realignment charge plus China restructuring and other special items totaling $9.8B of pre-tax adjustments [14]. On cash, FY2025 reported FCF was inflated by the $9.1B working-capital release. The two distortions pull opposite ways, so neither the $17.6B reported FCF nor the depressed GAAP earnings is a mid-cycle read.
The workings for a mid-cycle estimate: average GM's own automotive FCF across FY2024–25 ($14.0B and $10.6B → ~$12.3B), and cross-check against consensus, which sees FCF stepping from ~$9.7B (FY2025) to ~$11.9B (FY2028). Both point to a mid-cycle adjusted FCF of roughly $11–12B. On today's $87.9B market cap that normalizes to a 12.5%–13.5% mid-cycle yield — still comfortably above the 10% bar. A skeptic who normalizes on a weaker window (say, the trough automotive FCF of a recession year nearer $8–9B) lands around 9–10%, right at the line; the assumption that decides it is whether full-size truck and SUV volumes and pricing hold, which is where the Durability tab does its work.
The consensus check
CapIQ consensus free cash flow — the vendor's free_cash_flow mean, the closest direct proxy for adjusted FCF — clears the 10% bar in every forecast year, and the yield rises through the window as the EV-charge and tariff drag roll off.
Consensus FCF mean ($B) and implied yield on $87.9B market cap (derived: fit_features.consensus_forward_yield, source data/sp/estimates.json; CapIQ vintage as of the run date). FY2029 FCF mean is not disclosed by the vendor.
Because consensus forward FCF already clears the bar — 11.0% in FY2025 rising to 13.6% by FY2028 — the yield pillar does not require a mean-reversion underwrite. In the framework's terms, the sell side already agrees the cash is there; what is depressed is GAAP earnings and sentiment, not forward free cash flow. That is the "fear, not fundamentals" configuration on this one axis. The consensus does not sit below the bar, so there is no negative-FCF path to underwrite here — unlike the classic healthcare-forecasting-error setup.
One honest qualifier the framework insists on: it treats car companies as an explicit exclusion — "they screen cheap on FCF yield and never create long-term shareholder wealth; a value trap." GM clearing the yield bar is precisely the cheap-on-FCF-yield screen the exclusion warns about. The yield arithmetic passes; whether that yield is earned by a durable business is the question the Durability and Fit tabs decide, and it is not resolved on this page.
FCF / revenue trend
Conversion is volatile rather than trending. Reported FCF margin ran 6.3% in FY2023, dipped to 5.4% in FY2024, then jumped to 10.5% in FY2025 on the working-capital release [15].
FCF ÷ revenue, from reported financials, FY2021–25 [16].
Stripping the FY2025 spike, automotive FCF/revenue has held in a roughly 6–8% band — neither improving nor deteriorating on a trend basis. That is not the sliding-conversion pattern that would undercut a levered-flywheel case, but it is also not a widening one: GM converts revenue to cash at a steady, mid-single-digit automotive rate, consistent with a mature manufacturer rather than a compounder. Revenue itself fell 2.1% in FY2025 to $168.0B after two years of high-single-digit growth (derived: fit_features.revenue_trajectory) — one year of decline, not the three consecutive years the framework flags as a structural-decline disqualifier.
The year-10 gate asks one binary question with very high conviction: will revenue and adjusted free cash flow both be higher a decade out? GM is the #1-selling U.S. automaker with a 33% full-size-truck share and a decade of positive FCF, but it sits in a cyclical, capital-intensive, oligopolistic industry facing an unresolved EV transition ($7.9B of 2025 charges), a structurally impaired China business, and a $3.1B annual tariff drain. The gate does not hold — the doubt is genuine.
The conviction sources, graded for GM
Ruchir's durability conviction is built from structural facts, not from a great-company reputation. Each source below is graded for General Motors specifically; where it does not apply, that is said plainly.
Market structure — a global oligopoly, not a monopoly or duopoly. GM leads U.S. industry sales, but leadership is a plurality, not control. It held 17.2% of the U.S. market in 2025, up from 16.5% in 2024 and 16.2% in 2023, and 6.8% of the 90.7-million-unit worldwide market [1]. The global auto market is contested by roughly ten scaled manufacturers — Toyota, Volkswagen, Hyundai-Kia, Stellantis, Ford, Honda, Nissan, and a rising cohort of Chinese OEMs — so no single firm holds durable structural pricing power. GM's genuine strength is narrower and real: in U.S. full-size trucks it took 33.0% share in 2025 (up from 30.7% in 2023), the industry's most profitable and most defensible segment; in U.S. cars its share has collapsed to 2.1% (from 7.3% in 2023) as it exited sedans [2]. The truck franchise is the load-bearing conviction source; the rest of the portfolio is fully competitive. This builds on the fuller share picture in Business and Competitors — the point here is that stability lives in one segment, not across the enterprise.
Regulatory entry barriers — modest, and cutting both ways. Emissions, fuel-economy, and safety regimes raise the cost of entering vehicle manufacturing, which historically protected incumbents. But the same regimes now impose obligations that GM must fund (the EV build-out was driven partly by tightening emissions rules), and the 2025 rollback of U.S. EV consumer incentives and emissions stringency reversed GM's own capital plan, forcing $7.9B of charges [3]. Regulation raises the barrier to a new entrant but does not protect GM's margins; it is a weak moat here.
Capital intensity as a moat — present, but a double-edged one. GM carries an enormous asset base: property depreciation and amortization ran $9.6B and lease-vehicle depreciation $4.9B in 2025, and capital expenditure was $9.3B [4]. Replacing GM's plants, tooling, dealer network (4,566 GMNA + 6,276 GMI franchised dealers), and financing arm would cost tens of billions and take years — a genuine barrier to a would-be entrant [5]. The catch Ruchir's framework insists on naming: high fixed assets and high fixed labor costs under collective bargaining reduce flexibility in a downturn — GM itself notes that excess capacity and fixed costs push the industry into subsidized financing and price cuts that "may result in vehicle prices that do not offset our costs" [6]. Capital intensity is a moat against entry and a millstone in a recession.
Essentialness — high for the product category, contestable for the brand. Personal transportation is essential and demand is deep; the U.S. market absorbed 16.6 million units in 2025. But essentialness attaches to a vehicle, not a GM vehicle — a customer who leaves Chevrolet for Toyota or Ford loses nothing essential. Demand also proved cyclical, not recession-proof: GM's own filing calls the business "cyclical and depends in part on general economic conditions, credit availability, and consumer spending" [7]. The category is essential; the specific franchise is not irreplaceable.
Operating history — a >115-year brand on a 16-year-old balance sheet. This is the source most easily overstated. The Chevrolet and GMC brands are more than a century old, but the entity that owns them, General Motors Company, was incorporated in Delaware in 2009 [8] — formed out of the June 2009 Chapter 11 bankruptcy of its predecessor. The predecessor did not survive the last severe cycle; equity holders were wiped out. The current company has generated positive free cash flow every year since 2016, including through COVID-2020, so its 16-year record is clean — but "survived every cycle" is the one claim GM cannot make, and it is exactly the claim durability conviction most wants.
The structural threats, hunted and quantified
Execution is not a moat: a company that merely out-executes has no year-10 protection. GM out-executes today — it is gaining U.S. share and guiding to record 2026 earnings — but the threats below are structural, named in GM's own filings, and each carries a quantified year-10-relevant cost.
The EV transition — an unresolved technology substitution GM keeps mis-timing. GM has now twice mis-forecast the pace of EV adoption. In 2025, "consumer adoption of EVs has been slower than anticipated," and after the U.S. terminated EV tax credits GM "reassessed our EV capacity and manufacturing footprint," recording $1.6B and $6.0B of charges in Q3 and Q4 2025 — $7.9B total in GMNA [9]. This is the "is anyone's margin here an Amazon opportunity?" test in its sharpest form: GM's profit pool is concentrated in ICE full-size trucks, and the year-10 risk runs both ways — if EV adoption re-accelerates faster than GM can convert profitably, the truck franchise is exposed to new entrants (Tesla, Rivian, and Chinese OEMs); if it stalls, the EV capital already committed is stranded. GM cannot control which way the transition breaks, and it has been wrong on the timing before.
China — a structural decline already booked, with the JV itself expiring in 2027. China was once a ~$2-billion-a-year equity-income engine; it has structurally collapsed. GM's Automotive China joint ventures swung to an equity loss of $(4,407)M in 2024 — including a $2.1B other-than-temporary impairment and $2.0B of restructuring/equity losses — and a further $(316)M loss in 2025 [10]. China share fell from 8.4% in 2023 to 7.1% in 2025, and volume from 2,099k to 1,880k units [11]. GM attributes this to "aggressive competition from many of the largest global manufacturers and numerous domestic manufacturers…as well as non-traditional market participants, such as domestic technology companies," [12], and warns its "primary joint venture agreement for our China JVs expires in 2027," with renewal terms unsettled [13]. This is X3-relevant structural decline, isolated to one segment but material and ongoing.
Chinese low-cost OEMs — the substitution threat GM names directly. GM states that "manufacturers in countries that have lower production costs, such as China and India, have become competitors in key emerging markets and have begun offering their products in established markets… These actions have had, and are expected to continue to have, a significant negative effect on our vehicle pricing, market share, and results of operations" [14]. Chinese EV makers led by BYD are the clearest year-10 substitution risk — lower cost structure, faster EV product cadence, and expanding export footprint into GM's non-China markets. Independent web verification of the current pace of that expansion was unavailable this run (the research provider returned a billing error), so this threat rests on GM's own filed characterization, which is already explicit.
Tariffs — a policy-driven margin drain GM cannot control. New U.S. import tariffs cost GM $3.1B of EBIT-adjusted in 2025, and GM estimates a $3.0–4.0B hit for 2026 [15]. Against 2026 guided EBIT-adjusted of $13–15B, a $3–4B tariff drag is 20-30% of operating profit, recurring, and set by policy rather than by GM's execution.
Cyclicality and fixed labor — the recession exposure. GM's restructuring reserve rose to $3,948M at end-2025 from $1,243M, driven by EV realignment and severance [16]. A demand downturn, combined with fixed UAW labor costs and high fixed assets, is the mechanism that took the predecessor into bankruptcy in 2009. The current entity has not been tested by a credit-driven recession.
The disqualifier check — revenue trajectory
Ruchir's structural-decline disqualifier fires when revenue has declined high-single-digit for
three consecutive fiscal years. The deterministic feature file records
three_year_hsd_decline = false and consecutive_decline_years = 1.
Source: fit_features.revenue_trajectory (automotive net sales and revenue); FY2025 automotive revenue ($167,971M) tied to the Consolidated Income Statements [17].
The flag is absent. The only clustered decline was FY2019 (−7.8%) and FY2020 (−11.4%) — two years, broken by a +4.5% rebound in FY2021 and a +26.7% surge in FY2022. FY2025's −2.1% is a single low-single-digit dip. Revenue is cyclical, not in secular structural decline: the three-consecutive-HSD-decline disqualifier does not apply, and revenue is 26% higher in FY2025 than at the 2020 trough.
FCF consistency (P2)
The deterministic feature file returns fcf_stability and adjusted_fcf as not computable —
the pipeline flagged share-based compensation (SBC) as missing for every year and therefore could
not build the adjusted-FCF series or its rolling five-year average. Following the primary record
resolves both gaps. GM's reported free cash flow (operating cash flow − capex) is available every
year, and SBC is disclosed in the Consolidated Statements of Equity ($531M in 2025, $543M in
2024, $253M in 2023)
[18].
GM makes essentially no business acquisitions, so the framework's acquisition adjustment is a
genuine zero here (unlike a mis-mapped feed) — the "acquisitions" lines on GM's cash-flow
statement are marketable-securities and finance-receivable flows, not businesses bought
[19].
Adjusted FCF (FCF − SBC − 5-yr-avg acquisitions) therefore sits ~$0.5B below reported FCF each
year: FY2025 = $17,564M − $531M − $0 ≈ $17.0B.
Source: fit_features.adjusted_fcf.series[].fcf (reported FCF = operating cash flow − capex); FY2025 components ($26,867M OCF − $9,303M capex) from the Consolidated Statements of Cash Flows [20]. Adjusted FCF ≈ reported FCF − SBC − 5-yr-avg acquisitions; derived from company filings.
The series is positive in all ten years and never negative — a real strength — but it is noisy, not smoothly stable. Consolidated FCF ranges from $6.5B (2018) to $17.6B (2025), and both the 2020 and 2025 highs were inflated by large working-capital swings (a +$9.1B "change in other operating assets and liabilities" in 2025) rather than by durable earnings — 2025 net income was only $2.8B. GM's own cleaner metric, adjusted automotive free cash flow, was roughly $10.6B in 2025, down from ~$14.0B in 2024 (2025: $18.7B automotive OCF − $9.2B capex + $1.1B management actions) [21]. The negative-episode test is passed — there are no negative FCF years in the record — but the absence is not the insurance/banking underwriting-cycle pattern; GM's cash generation is demand-cyclical, and its predecessor's FCF did turn sharply negative in the 2008-09 recession the current entity has not faced. Consistent enough to clear the "no repeated negative episodes" bar; not so stable that a severe cycle could not break it.
The year-10 case, both ways
The strongest case that revenue and adjusted FCF are both higher. GM is the U.S. market leader and gaining share (16.2% → 17.2% over three years), dominant where the money is (33% of full-size trucks), and guiding to 2026 EBIT-adjusted of $13–15B and net income of $10.3–11.7B [22]. Revenue has grown from $109B (2020) to $168B (2025). FCF has been positive for a decade, and GM is retiring float aggressively — shares outstanding fell from 1,570M (2016) to 973M (2025), a 38% reduction — so even flat aggregate FCF compounds on a per-share basis. If the China charges and EV realignment prove to be one-time resets and tariffs are mitigated, normalized earnings power is well above 2025's depressed net income.
The strongest doubt. The gate requires very high conviction that both revenue and adjusted FCF are higher in ten years. That conviction is not available here. GM operates in a cyclical, capital-intensive, oligopolistic industry with no durable pricing power; it is mid-way through a technology substitution (EVs) it has already mis-timed twice, at a cost of $7.9B in a single year; its second-largest profit engine (China) has structurally collapsed and its access there depends on a JV that expires in 2027; it absorbs a $3–4B annual tariff cost it does not control; and its own corporate predecessor did not survive the last severe recession. Each of these is structural, not an execution stumble, and any one could hold year-10 FCF at or below today's level.
The gate does not hold. Revenue being higher in a decade is plausible; adjusted FCF being higher with very high conviction is not, because too many of the variables that determine it — EV-transition timing, China, tariffs, the credit cycle — sit outside GM's control and cut against it. The genuine doubt is not a single item but their convergence on a business with no structural moat beyond one truck franchise. What would change the read: durable evidence that the EV transition has resolved in GM's favor (or stalled permanently, leaving the ICE truck pool intact), a stabilized and profitable China position on renewed JV terms, and one full recession navigated with FCF still positive. Until then, this is a genuine doubt: X — the year-10 adjusted-FCF gate is not met with the required conviction.
Self-Help
General Motors can fund repurchases without straining itself. Its automotive operations run roughly $5.5 billion of net cash inside $35.7 billion of available liquidity, with just $663 million of automotive debt maturing in 2026 [1] [2] [3]. The buyback engine is real and executed — $23 billion returned since November 2023, share count down about 35% to roughly 900 million [4]. The framework's hard-fail, a rising share count, is absent.
The balance sheet against the problem's duration
The deterministic feature file could not classify GM's balance sheet — the structured debt fields are empty for FY2025 — so the class is established here directly from Note 13 of the 10-K. The answer depends entirely on separating the two GMs.
Automotive carried $16.2 billion of debt at December 31, 2025 — $15.5 billion of it senior unsecured notes, at a 5.8% weighted-average long-term rate — against $21.7 billion of cash and marketable securities and a further $13.9 billion of undrawn committed facilities, for $35.7 billion of total automotive liquidity [5] [6]. On an industrial basis GM is net cash by about $5.5 billion, and management targets an average automotive cash balance of $18.0 billion as the second pillar of its capital-allocation program, ahead of any return of capital [7].
GM Financial carried $114.0 billion of debt [8]. That figure dominates the consolidated balance sheet, but it is a captive-finance book: most of the secured portion was issued by consolidated VIEs and is repayable only from the pledged receivables and lease assets, and GM Financial funds itself continuously in the securitization and unsecured markets, holding $34.8 billion of its own liquidity against a policy of covering at least six months of net cash flows without market access [9]. It is not a call on automotive cash; treating it as recourse leverage would misread the structure.
Automotive Debt
Automotive Liquidity
Auto Debt Due 2026
GM Financial Debt
Source: FY2025 10-K, Note 13 Debt [10] and MD&A Automotive Liquidity [11].
The maturity schedule confirms that the automotive side faces no wall. The year-by-year contractual maturities from the debt footnote:
Source: FY2025 10-K, Note 13 Debt — contractual maturities at December 31, 2025; "Thereafter" adds $10,528M automotive and $14,163M financing [12].
Automotive maturities never exceed $1.9 billion in any single year through 2030, against $35.7 billion of standing liquidity and $18.7 billion of 2025 automotive operating cash flow; automotive interest expense was only $727 million for the year [13]. The $35.1 billion of "GM Financial" maturities due in 2026 is the routine roll of a finance book that reissued $19.6 billion of securitizations and $10.6 billion of senior notes during 2025 alone. GM renewed its core five-year, $10.0 billion revolving facility in March 2025 (now maturing 2030) and its $4.1 billion three-year facility (2028), and reported no technical defaults or covenant violations at year-end [14] [15]. On the durability question this tab owns, the balance sheet does not force capital allocation toward debt paydown: the automotive maturity load is small enough that repurchases and refinancing are not in competition.
The repurchase record — executed, not authorized
This is where GM separates itself from the framework's usual value-trap warning. The share count has fallen every year of heavy buyback activity, and the cash behind it is on the cash-flow statement, not in a press release.
Source: FY2025 10-K, Consolidated Statements of Cash Flows (repurchases of common stock), FY2016–FY2025 [16]; figures match data/financials/cash_flow.json.
Source: derived from reported financials, FY2016–FY2025; series matches fit_features.share_count_trend (weighted diluted basis). Year-end shares issued and outstanding fell to 904 million at December 31, 2025 from 995 million a year earlier [17].
The concentration is the point: buybacks were minimal from 2018 through 2021 (share count actually drifted up on stock compensation), then GM spent $11.1 billion, $7.1 billion and $6.0 billion in 2023–2025, retiring 215 million shares immediately on the November 2023 accelerated repurchase and continuing through open-market purchases and further ASRs since [18]. Cumulatively, $23 billion has retired more than 465 million shares — about 35% of the company — since late 2023, leaving roughly 930 million diluted shares at year-end 2025 and 893 million by mid-2026 [19] [20].
On prices paid. The blended cost of the post-2023 program is roughly $49 per share ($23 billion across 465 million shares), with Q4 2024 open-market purchases disclosed at about $53 [21] [22]. Against the current $90.30, those repurchases have compounded — the buybacks were executed well below today's price, which is the accretive case rather than the buying-high one.
The hard-fail test. The framework excludes companies whose share count keeps rising on stock-based compensation or serial acquisitions. GM's runs the other way: down 38% over the decade on the fit-features basis (1,570 million to 973 million), a −7.6% five-year CAGR, funded by cash repurchases rather than papered over by dilution. On this pillar the hard-fail condition does not apply.
Management's buyback intent, from the record
The record speaks louder than the Q&A here — the buyback rarely drew a broker question, but management's prepared remarks are explicit about priority and about the flywheel itself. On the Q4 2025 call GM framed repurchases at current levels as "one of the most compelling opportunities to continue to generate long-term shareholder value," approved a fresh $6 billion authorization and raised the dividend 20% [23]. By Q2 2026, with $3.5 billion remaining under the authorization, management tied the program directly to EPS: continued repurchases mean "we can expect even further EPS growth" [24] [25].
The counter-fact belongs in the same breath. When tariffs became acute in Q1 2025, GM did exactly what the framework warns against — it paused repurchases "until we have more certainty with respect to our operating environment" [26]. The pause proved temporary: the ASR already in the market settled, and by Q2 2026 open-market buying had resumed at $2 billion a quarter [27]. The episode shows the priority order the balance-sheet pillar implies — liquidity and investment-grade standing come first, repurchases after — but it did not derail the program.
Insider buying does not corroborate the conviction. Across the last two years of Form 4 activity there were no open-market purchases by insiders — only option exercises and roughly $100 million of 10b5-1 programmed sales, and beneficial ownership is dominated by index funds (BlackRock, Vanguard, State Street). The company is buying its stock; its officers are not.
Source: SEC Form 4 activity and SC 13G filings, data/governance/. No PDF page; insider-transaction detail is structured data, as reported.
The levered exception, and the absurdity check
The levered-exception path — where debt is tolerated because the adjusted yield is massive (~25%+) alongside a multi-year share-count halving — does not need to be run, because it is not triggered. Consensus forward free-cash-flow yield sits near 11% (about 11.3% on FY2026 estimates), far below the 25% gate, and on an industrial basis GM is net cash rather than levered in any case.
Consensus forward FCF yield from fit_features.consensus_forward_yield (source: S&P estimates); the full adjusted-yield computation lives in the Yield tab.
The absurdity check asks how many years of adjusted free cash flow would retire the entire equity float at today's price. The deterministic float_retirement_years is not computable here — adjusted FCF depends on stock-based-compensation figures the pipeline is missing — so the arithmetic is shown on the consensus forward figure instead: an $87.9 billion market capitalization against roughly $9.9 billion of consensus FY2026 free cash flow is about 8.9 years. That is a normal-to-cheap multiple, not the ~3-year figure that signals a price making a claim it cannot survive. The self-help math is favorable; it is not extreme.
Dividend safety
The dividend is immaterial to the case. After a 20% raise to $0.18 per quarter, the forward payout is roughly $0.72 a share — under 0.8% at the current price — and 2025 dividends of about $657 million were covered many times over by free cash flow [28] [29]. GM suspended the dividend in 2020 and reinstated it at a reduced level, so the payment record is not continuous; but at this size the dividend is a rounding item next to the buyback, and no part of the return leans on it.
Management credibility
The promise-versus-delivery record is mixed, and the split is instructive: GM delivered on the core automotive business it controls and abandoned the two secular bets the whole industry misjudged.
EV profitability and volume — broken. For seven consecutive calls management guided to a hard EV ramp: variable-profit-positive Ultium volumes and, as late as January 2025, "$2 billion to $4 billion" of EBIT improvement on roughly 300,000 wholesales. By Q3 2025 the admission was blunt — "it's clear that near-term EV adoption will be much lower than planned" [30] — and GM recorded $10.9 billion of EV-related charges from late 2025 through mid-2026 [31]. The 300,000-unit target simply disappeared from later disclosure.
Cruise robotaxi — abandoned. Cruise carried its own expense line and a commercialization promise through 2024; it was wound down, at about $1.1 billion of cash cost in 2025 alone [32].
North America margin — delivered after a wobble. The 8–10% North America EBIT-adjusted margin target came under real pressure through 2025 as tariffs landed; by Q2 2026 it was delivered, "solidly back within our 8% to 10% margin target" at 8.6% [33]. Tariff mitigation over-delivered: a $4–5 billion gross-cost guide became $3.1 billion actual for the year [34]. And on warranty, management named the problem before analysts did — "this is too high, and we need to do better" — then guided the line to a full-year benefit [35].
This is not the promotional-CEO exclusion the framework guards against — that pattern is big claims, repeated misses on the base business, and management to next quarter's number. GM's misses were on multi-year strategic bets it disclosed and then reversed with unusual candor, while the core-business guidance was generally met or beaten. The credibility mark to carry forward is real but bounded: the EV and Cruise reversals were expensive promises broken, so forward "growth adjacency" claims — GM Defense, GM Insurance, energy storage, each with a single call of disclosure and no sizing — deserve the same discount until numbers appear. Skin in the game is thin (index-fund ownership, no insider buying), which is the one genuine overlap with the exclusion profile, but it stands alone rather than alongside a pattern of quarterly-EPS management.
Clock
The re-rating this framework hunts for has already happened. General Motors fell on the 2025 tariff shock, bottomed near $42 in April 2025, and closed at an all-time high of $90.30 on 28 July 2026 — above every pre-tariff level. The feared event did not break the earnings power; management has raised 2026 guidance twice and retired 35% of the share count since 2023. Consensus is already positioned "Buy." Long-dated listed options exist; implied volatility sits near 38%.
The clock has already run
The Clock tab asks what would make the market re-recognize value, and roughly when. For GM the honest answer is that the mechanism has largely fired. The stock's most recent dislocation — a tariff-driven decline from a local peak of $60.20 on 25 November 2024 to a trough of $42.48 on 8 April 2025, a fall of about 29% — reversed over the following fifteen months. GM last closed at $90.30, its highest close since the 2010 re-listing, sitting at the very top of its 52-week range ($52.11–$90.30).
Source: derived from the run's daily price history (data/prices/daily.json), quarter-end closes; latest close 28 July 2026, an all-time high.
For Ruchir's system the consequence is direct: the entry trigger it looks for — peak fear, forced selling, a stock anchored to a temporary earnings cut — is not present today. The dislocation anatomy sits in Dislocation; what remains for this tab is the mechanism that closed the gap, GM's own base rates for how long such gaps take, and the instrument facts.
What closed the gap — the mechanisms, dated
Three mechanisms drove the recovery, and each is documented in the record rather than inferred.
A feared event that failed to break earnings power. The 2025 decline tracked the imposition of U.S. auto and parts tariffs. GM addressed the parts-stacking and offset mechanics from its Q1 2025 call onward [1], and by Q3 2025 guided to offsetting roughly 35% of the gross tariff impact through go-to-market, cost, and footprint initiatives [2]. On the Q2 2026 call (21 July 2026) management reported North America EBIT-adjusted margin back to 8.6%, "solidly back within our 8%–10% margin target," up 2.5 points from a year earlier "when tariffs were first put into place" [3]. Full-year gross tariff cost is still guided at $2.5–3.5 billion, largely flat year-over-year [4]. The tariff was absorbed, not survived narrowly.
Guidance resetting against a low bar. GM raised 2026 guidance twice in the first half — the Q2 call marked the second raise of the year [5], lifting EBIT-adjusted to $14–16 billion, adjusted EPS to $12–14, and adjusted automotive free cash flow to $9.5–11.5 billion [6]. A tariff-depressed 2025 base made the upward revisions easy for the market to reward.
Buybacks shrinking the denominator. This is the most durable of the three and the one still running. Diluted share count ended Q2 2026 at 893 million, about 8% below Q2 2025 and 35% below Q2 2023, with $3.5 billion remaining under the current authorization [7]. Across the full-year figures the count has fallen from roughly 1.57 billion shares in 2016 to 973 million at fiscal 2025 — a five-year retirement CAGR of about −7.6%.
Source: share counts from data/ruchir/fit_features.json (share_count_trend), derived from company filings; Q2 2026 interim count of 893M from the Q2 FY2026 transcript [8].
The buyback flywheel is the mechanism most aligned with the framework — at a double-digit consensus FCF yield, retirements alone add materially to per-share figures — but its power was greatest at the 2025 lows, not at today's price. The executed-repurchase record and management's stated intent are examined in Self-Help.
Base rates from GM's own history
Since its 2010 re-listing GM has been a serial deep-drawdown name — a quality-plus-cyclical franchise whose price swings far more than its intrinsic value. Four episodes since 2011 fell 35% or more from a prior high; every one eventually recovered to that high, but the round trips ran roughly three to four years.
Source: derived from the run's daily price history (data/prices/daily.json); depth = (trough close − peak close) ÷ peak close, running-peak method. Recompute inputs below.
Source: derived from data/prices/daily.json. Episode peaks/troughs (close): $38.98 (Jan-2011)→$18.80 (Jul-2012); $41.53 (Dec-2013)→$26.90 (Feb-2016); $46.48 (Oct-2017)→$16.80 (Mar-2020); $65.74 (Jan-2022)→$26.65 (Nov-2023). Recovery = first close back at the prior peak.
The arithmetic a skeptic can recompute: median drawdown depth across the four is about 55%; peak-to-trough took 19–29 months; trough-to-recovery took 10–23 months; full round trips ran 1,060–1,386 days (roughly 2.9–3.8 years). The 2020 episode was the deepest (−64%) but recovered fastest (10 months from the COVID trough), because the shock was macro and V-shaped. The relevant clock for this framework — which would enter near maximum fear, not at the peak — is the trough-to-recovery leg: 10–23 months, centered near 18.
The current episode does not appear as a fifth deep drawdown on the running-peak method, because the 2024–25 tariff dip bottomed at $42.48 — below the November-2024 local peak of $60.20 but above the deeper 2023 trough — and the stock then made new highs. The deterministic capitulation gauge measured that dip at −29% with a volume spike of only about 1.6x median (capitulation_gauge in data/ruchir/fit_features.json): a real decline, but shallower than GM's historical capitulations and without the forced-selling volume signature the framework treats as peak fear. That reading is developed in Dislocation.
The 18-month test
GM's own base rates make re-recognition within 18–24 months a reasonable expectation for an entry made near a trough — trough-to-recovery has run 10–23 months in every prior deep episode, centered near eighteen. But that test is retrospective here: there is no live dislocation to time. At $90.30, an all-time high with the 52-week position at 100%, the re-rating has already occurred. The read would flip to a live 18-month clock only if a new drawdown of comparable depth opened and the driving mechanism — the tariff/pricing normalization already largely complete, or a future industry repricing — failed to fire on schedule (the falsifier-ledger conditions: FCF or EBIT beginning to slide where flat was underwritten, or three consecutive years of revenue decline).
What consensus expects, and when
The sell side is already positioned for the recovery it has, in effect, been paid to wait for. Across aggregators the consensus rating is "Buy" / "Moderate Buy" — on one 27-analyst tally, 21 of 27 rate Strong Buy or Buy — with a mean price target of about $98.65 (a second aggregator's mean is $103.10). Against the 28 July close of $90.30 that implies roughly 9–14% of upside to the average target, with a target range of $61–$132.
Source: consensus free-cash-flow means from data/ruchir/fit_features.json (consensus_forward_yield, CapIQ), scaled to absolute; yield on the 28 July 2026 market capitalization of about $87.9 billion.
Consensus does not expect a recovery to appear in future printed numbers — it already has. First-half 2026 adjusted diluted EPS of $7.27 was GM's best first half ever, more than 25% above the prior high [9], and FCF has run consistently above $10 billion since 2022 versus a $3–5 billion decade average [10]. On CapIQ's path, forward FCF rises from about $9.9 billion (2026) to $11.9 billion (2028), a forward yield climbing from roughly 11% to 14% on the current market capitalization — the sell-side already agrees the yield clears a double-digit bar. (Whether it clears Ruchir's adjusted yield bar, after stock-based compensation and acquisition spend, is a separate question taken up in Yield, where the adjustment is not computable from the current feed.)
The candidate printed quarter for the next incremental move is Q3 2026, expected around 20 October 2026 (management has confirmed no date beyond the July report). Management has already flagged 2027 as a growth year — expecting to grow revenue, margins, EBIT, and free cash flow — driven by EV-loss reduction, OnStar digital revenue, warranty gains, and a full year of the next-generation Silverado and Sierra, which begin arriving in December 2026 [11]. These are drivers of continued compounding, not of a gap-closing re-rating; the gap is closed.
The instrument facts
Long-dated listed options on GM exist. Standard equity LEAPS are listed with January 2027 and January 2028 expiries — the January 2028 series was introduced in September 2025 — so contracts with more than 18 months to expiry are available on the name. GM is a mega-cap NYSE constituent with an actively traded listed-options market across weekly, monthly, and LEAPS expiries; a precise, dated open-interest figure was not captured from a citable source, so it is stated only at that qualitative level.
On implied volatility: per third-party options-market data (AlphaQuery), GM's 30-day mean implied volatility stood at about 38% (0.383) on 28 July 2026, with call IV near 39% and put IV near 38%. Against the framework's reference lines — up to roughly 50–55 acceptable, 60–70 elevated — a level near 38% is not elevated.
These are stated as facts, not as suggestions. The framework's own consequence follows from them plainly: qualifying long-dated options do exist and volatility is not prohibitive, so the name would not be routed to the watchlist on instrument grounds. What keeps it off the book under this system is upstream — the absence of a live dislocation to express, given a price at all-time highs.
Instrument facts (28 July 2026): long-dated LEAPS to January 2028 exist; 30-day implied volatility about 38%, below the elevated zone. No advice, strikes, expiries, or sizing are implied by these facts.